Free Forex EAs & Indicators Download
The largest library of verified trading tools. EAs, indicators, all free.
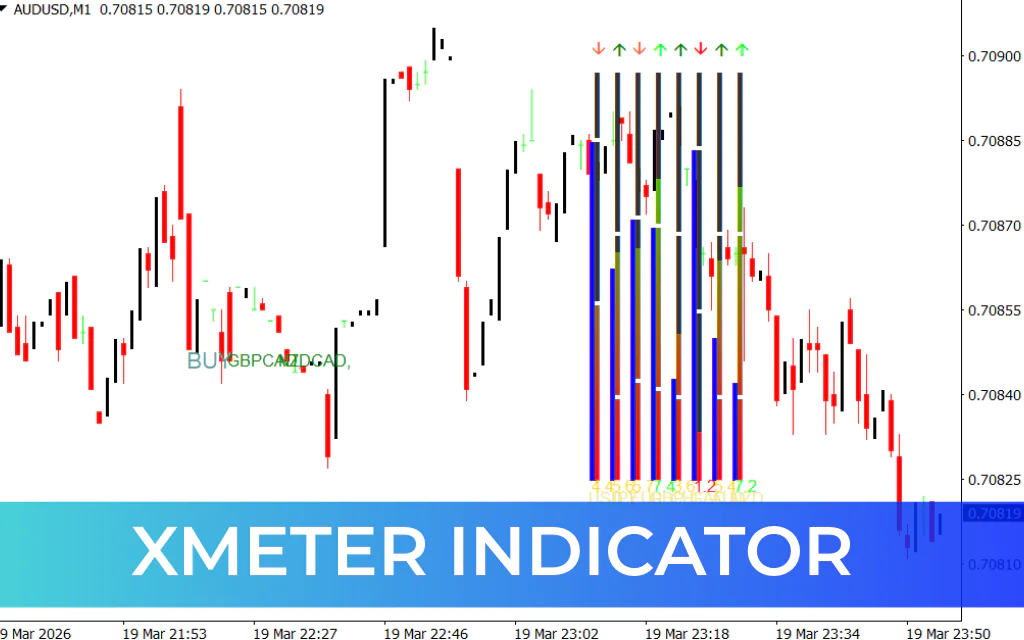
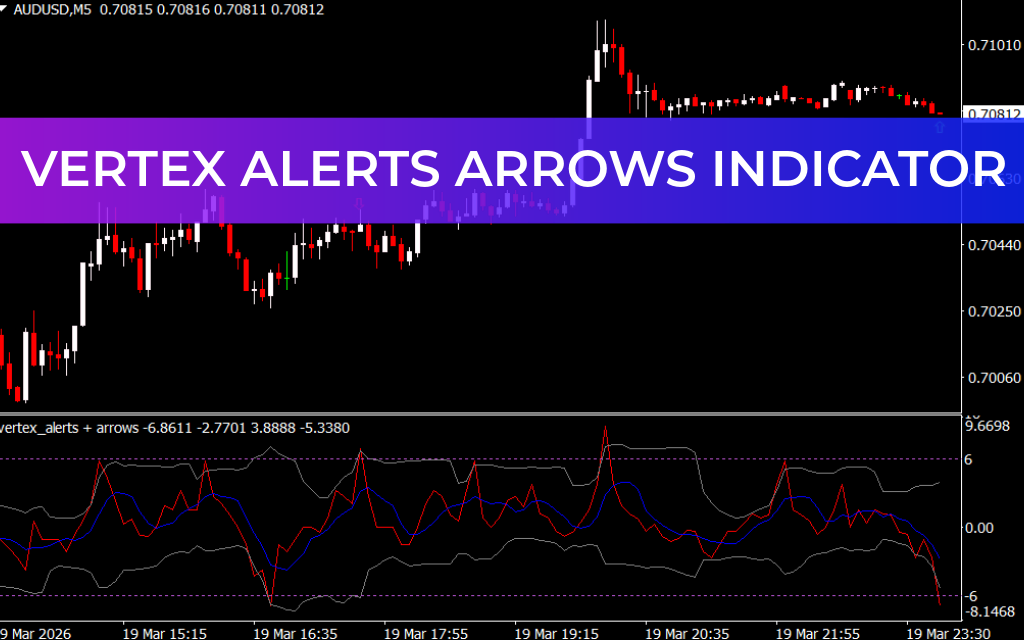
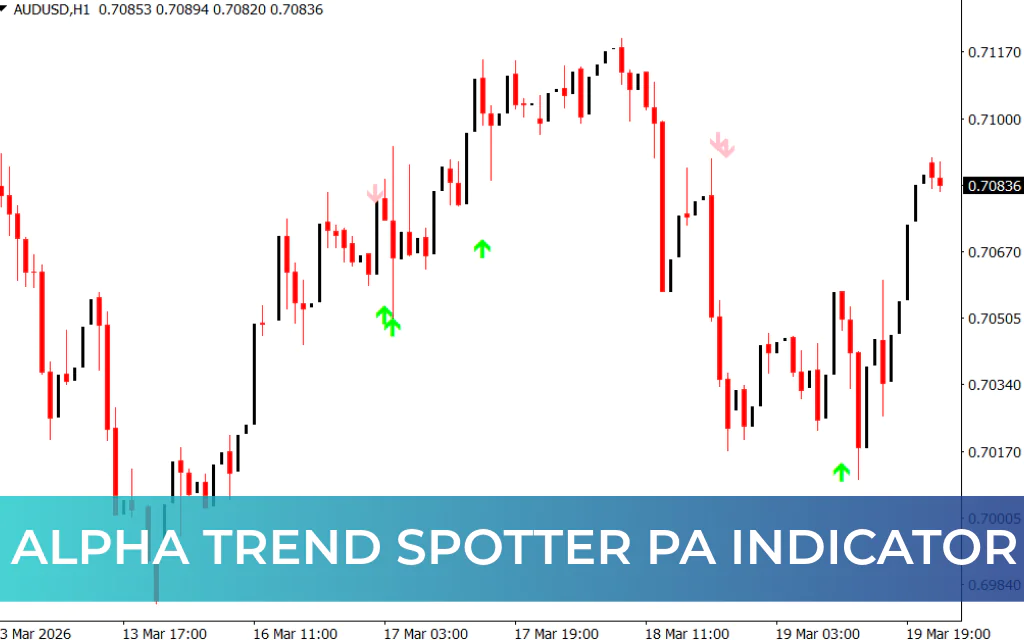
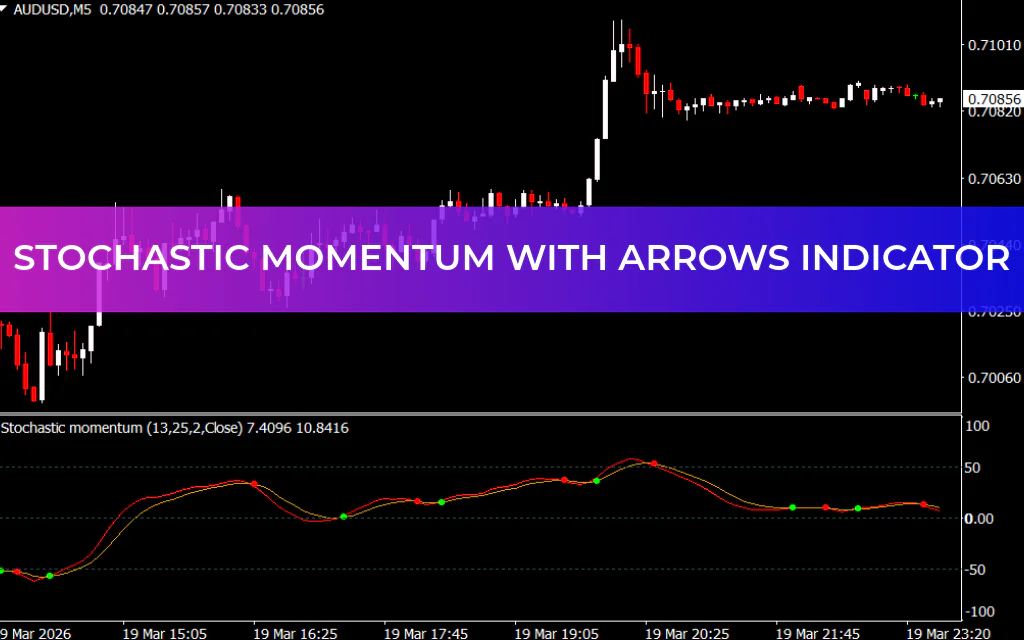
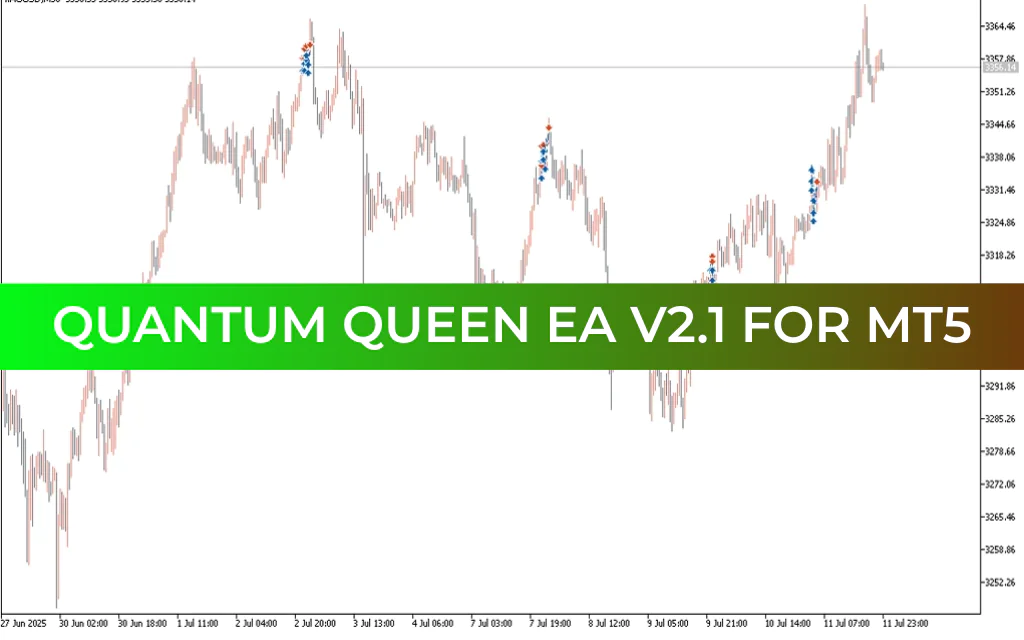
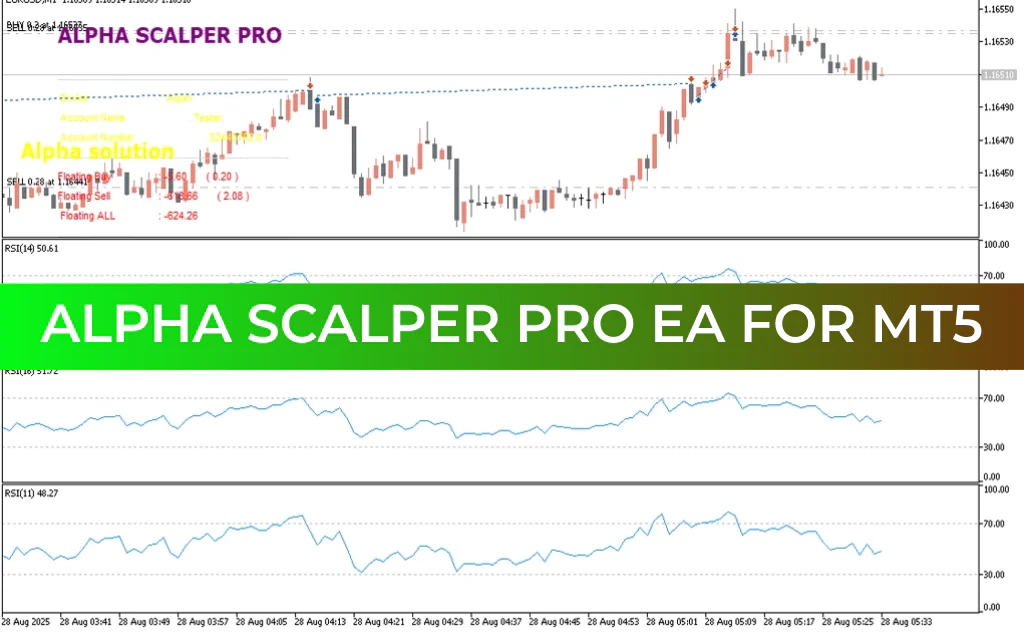
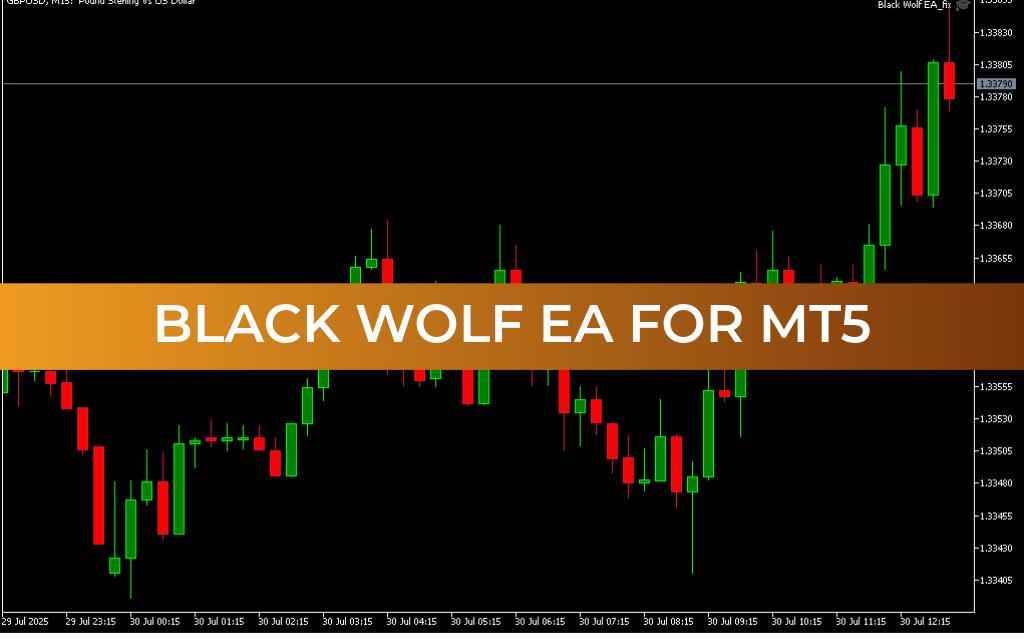
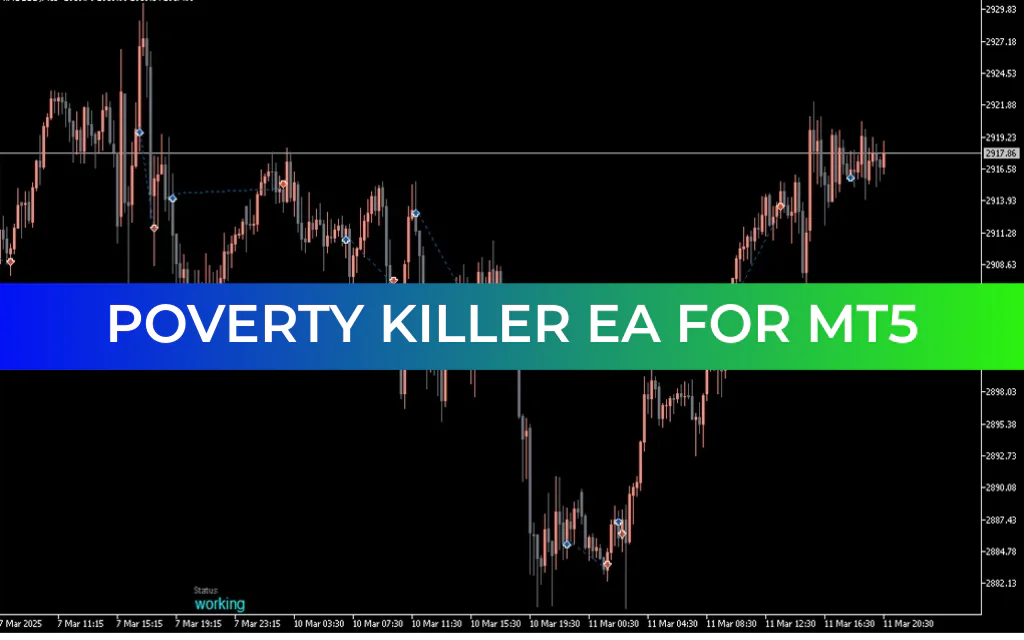
Our Latest Items


FAQ's
Got questions? We've got answers. Delve into our Frequently Asked Questions (FAQs) section to find comprehensive information about our items, services, and more.
- Download the EA file (.ex4 for MT4 or .ex5 for MT5).
- Open MT4/MT5 → File → Open Data Folder.
- Go to MQL4/Experts or MQL5/Experts.
- Paste the file into that folder.
- Restart the platform (or right-click Navigator → Refresh).
- Drag the EA onto a chart and enable AutoTrading.
Yes. All EAs and indicators on our site are completely free. We share both free tools and leaked premium tools for educational purposes. We always recommend testing on a demo account first.
Some EAs are designed for prop firm challenges — look for the Prop Firm tag. Always ensure the EA follows your firm's rules for drawdown, lot sizes, and trading restrictions.
Join our Telegram group and submit your request. Our team will try to source and share the tool. Premium members get priority handling for requests.
Yes. We have a dedicated Source Code section with decompiled and open-source files. It's useful for learning MQL programming and customizing EAs to your needs.
A pip (percentage in point) is the smallest standard price move in forex. For most pairs it's the 4th decimal place (0.0001). For JPY pairs it's the 2nd decimal place (0.01).
A common rule is to risk 1–2% per trade. Use our Lot Size Calculator to get the right lot size based on your account size, risk %, and stop loss distance.
Leverage lets you control a larger position with less capital (e.g. 1:100 means $100 can control $10,000). Margin is the deposit required to open that position. Higher leverage increases both potential profit and risk.
The London–New York overlap (around 8:00 AM–12:00 PM EST) usually has the highest volatility. The Asian session is often quieter. Use our Market Hours tool to see live session times.
Prop firms give you funded capital to trade after you pass a challenge. You typically keep 70–90% of the profits. Popular firms include FTMO, The5ers, and MyForexFunds. See our Prop Firms comparison page for details.