Forex trend reversals are a natural and unavoidable part of the market. Wherever a trend exists, a reversal is likely to follow sooner or later. Many trading strategies are built around this simple reality — identify when a trend is changing and position yourself to ride the next move.
To do that successfully, traders rely on tools designed to detect potential turning points. One such tool is the Lucky Reversal MT4 Indicator, a popular trend-Reversal Indicator known for its simple visual signals and practical confirmation capabilities.
This guide explains how the indicator works, its strengths and weaknesses, and how to use it effectively in real trading conditions.
What Is the Lucky Reversal Indicator?
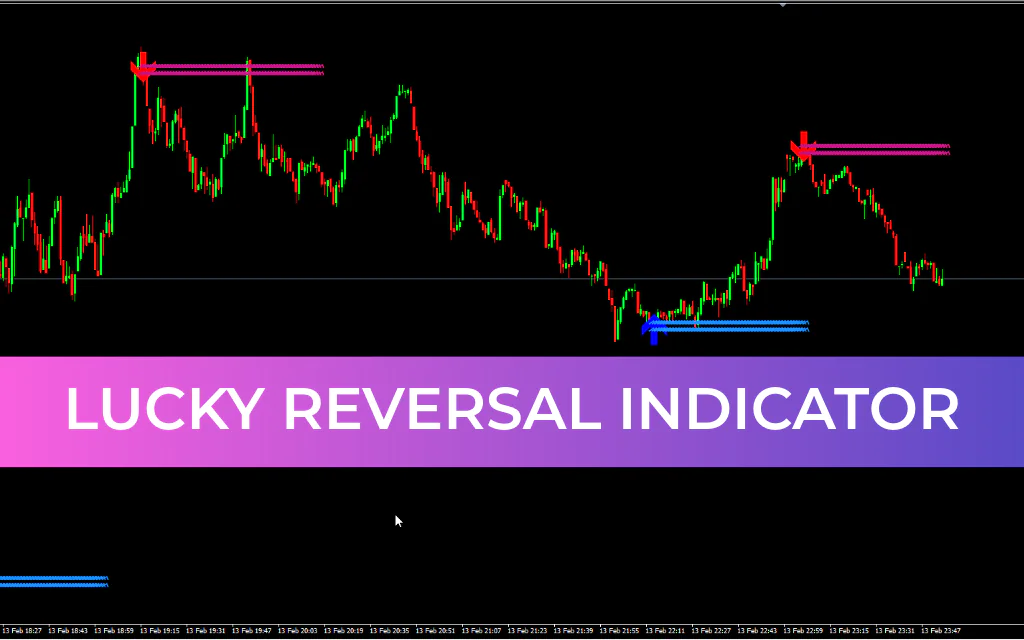
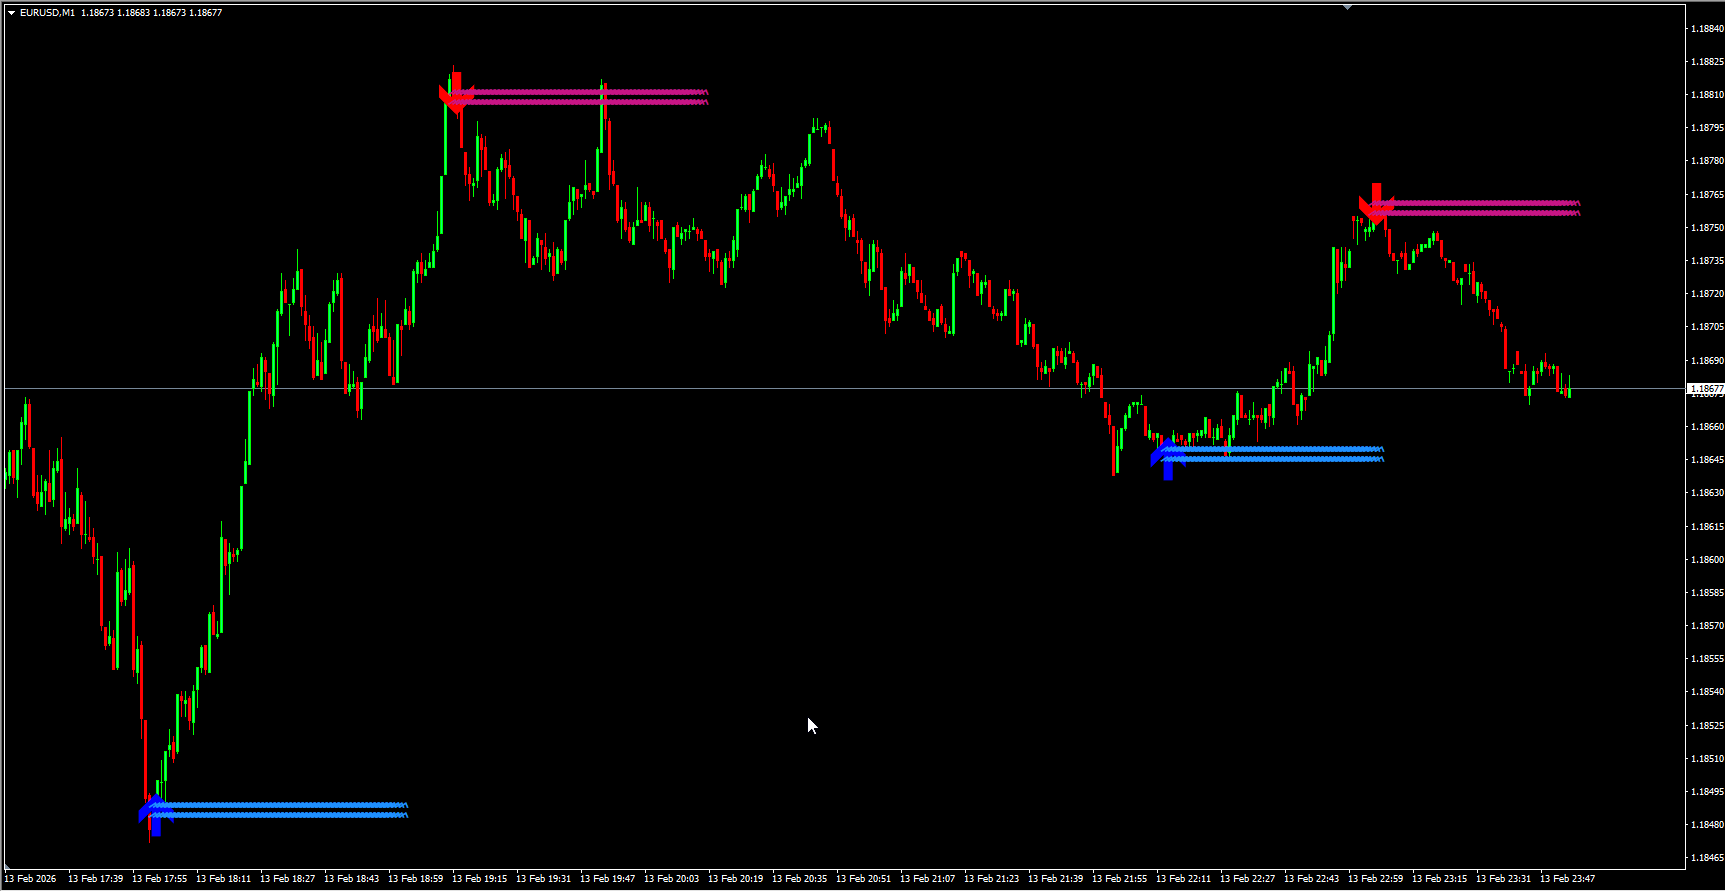
The Lucky Reversal Indicator is designed to help traders identify when a market trend changes direction — whether from an uptrend to a downtrend or vice versa.
It uses clear visual signals on the chart:
Blue arrow → signals the start of an uptrend
Red arrow → signals the start of a downtrend
Wavy horizontal lines → mark the projected direction of price movement
White square → indicates a potential or temporary reversal that is not yet confirmed
The white square is a subtle but important feature. It appears when the indicator detects early signs of a possible trend shift. If that shift becomes confirmed, the square changes into a blue or red arrow.
This structure makes the indicator very easy to read — even at a glance.
The Major Flaw of the Lucky Reversal Indicator
Like many trend-confirmation tools, the Lucky Reversal Indicator is lagging.
This means it does not predict reversals in advance. Instead, it confirms them after they have already begun.
Many traders misunderstand this behavior. During backtesting, signals often appear to align perfectly with major highs and lows. It can look like the indicator predicts turning points precisely.
However, in live trading, signals typically appear only after the market has already reversed. The arrow is plotted once the reversal is confirmed — not when it first starts.
Because of this delay, the indicator is not ideal for traders trying to capture the very beginning of breakout reversals.
The Major Strength of the Lucky Indicator
Interestingly, the same feature that makes the indicator weak for early entries makes it extremely valuable for confirmation.
Because it waits for confirmation, the Lucky Reversal Indicator helps traders avoid false signals and premature entries. Instead of trying to catch the exact turning point, it helps you trade the newly established trend with greater confidence.
For example, if the market has clearly reversed from a downtrend into an uptrend, the indicator confirms that shift — allowing you to trade the continuation of the move rather than guessing the turning point.
This makes it an excellent trend-confirmation tool.
Trading Strategies Using the Lucky Reversal Indicator
The most effective way to use the Lucky Reversal Indicator is as part of a complete trading system. It works best when combined with other technical tools such as:
Moving averages
Support And Resistance levels
Candlestick patterns
Chart patterns
Momentum indicators
Below are two practical strategies.
Strategy 1: Combining Lucky Reversal with Moving Averages
This is one of the most effective ways to trade confirmed trends.
Setup
Add the Lucky Reversal Indicator to your chart.
Add two Moving Averages:
One with default settings (fast MA)
One set to 20 periods (slow MA)
Use different colors for clarity.
Trading Rules
Uptrend
Wait for a blue arrow from the Lucky Indicator.
Enter a buy trade only when the fast MA crosses above the slow MA.
Hold the trade until a red arrow appears.
Downtrend
Wait for a red arrow.
Enter a sell trade when the fast MA crosses below the slow MA.
Hold until a blue arrow appears.
You can adjust moving average periods or replace them with other trend-following indicators. The key is combining confirmation with momentum.
Strategy 2: Trading White Square Confirmations
The white square provides an early warning of a possible reversal.
How to trade it
A white square appears → market may be preparing to reverse.
Wait for confirmation.
When the white square changes into:
Blue arrow → enter buy trade
Red arrow → enter sell trade
Enter at the close of the confirmation candle.
This approach is simpler but still relies on confirmed signals rather than predictions.
Trade Management
Proper risk management is essential with any indicator.
Take Profit
Set predefined price targets. Do not rely on opposite signals to exit trades.
Stop Loss
Risk no more than 2% of capital per trade.
Place stops at logical technical levels.
Some traders use the indicator’s wavy lines as reference zones, since price rarely crosses them — but this is not always optimal for risk-to-reward.
Lucky Reversal Indicator FAQ
Who is it best for?
Intermediate and experienced traders benefit most. Beginners can use it if they understand lagging indicators and trend confirmation.
Best time frames?
Higher time frames work best:
H1
H4
Daily
They reduce market noise and improve reliability.
Why does it lag?
It confirms reversals after they start. This reduces false signals but means missing early entries.
Can it be used alone?
Yes, but not recommended. Combining it with other indicators improves accuracy.
What does the white square mean?
It signals a potential reversal. If confirmed, it changes into a directional arrow.
What if price moves against the signal?
Always use stop losses and risk management. No indicator is perfect.
Does it work in volatile markets?
Yes, but signals may become less reliable. Additional confirmation is recommended.
Common mistakes to avoid
Using it without confirmation tools
Ignoring Market Structure
Trading highly volatile conditions blindly
Expecting it to predict reversals
Bottom Line
The Lucky Reversal Indicator is a powerful trend-confirmation tool rather than a prediction tool. Its simple visual signals make it easy to use, while its lagging design helps filter false reversals.
When combined with moving averages, market structure, or other technical indicators, it can significantly improve trade timing and confidence.
Used correctly — and with proper risk management — it can become a valuable component of any forex trading system.
FAQ
52 Downloads
Last Update:
Feb 16, 2026 03:49 AM
Published:
Feb 15, 2026 13:42 PM
Category: