Supply And Demand zones are among the first concepts beginner forex traders learn. These zones are essential because price often reacts to them, even years after they originally formed. The Supply and Demand Zones Indicator for MT4 simplifies the process by automatically drawing these historical zones on your chart, eliminating the need to mark them manually.
What Is the Supply and Demand Zones Indicator?
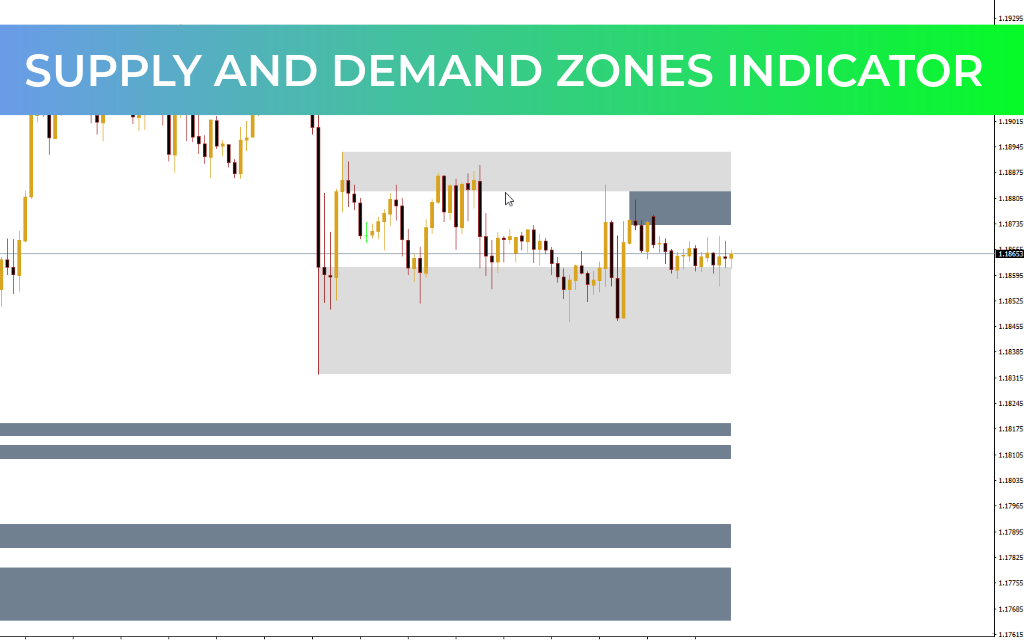
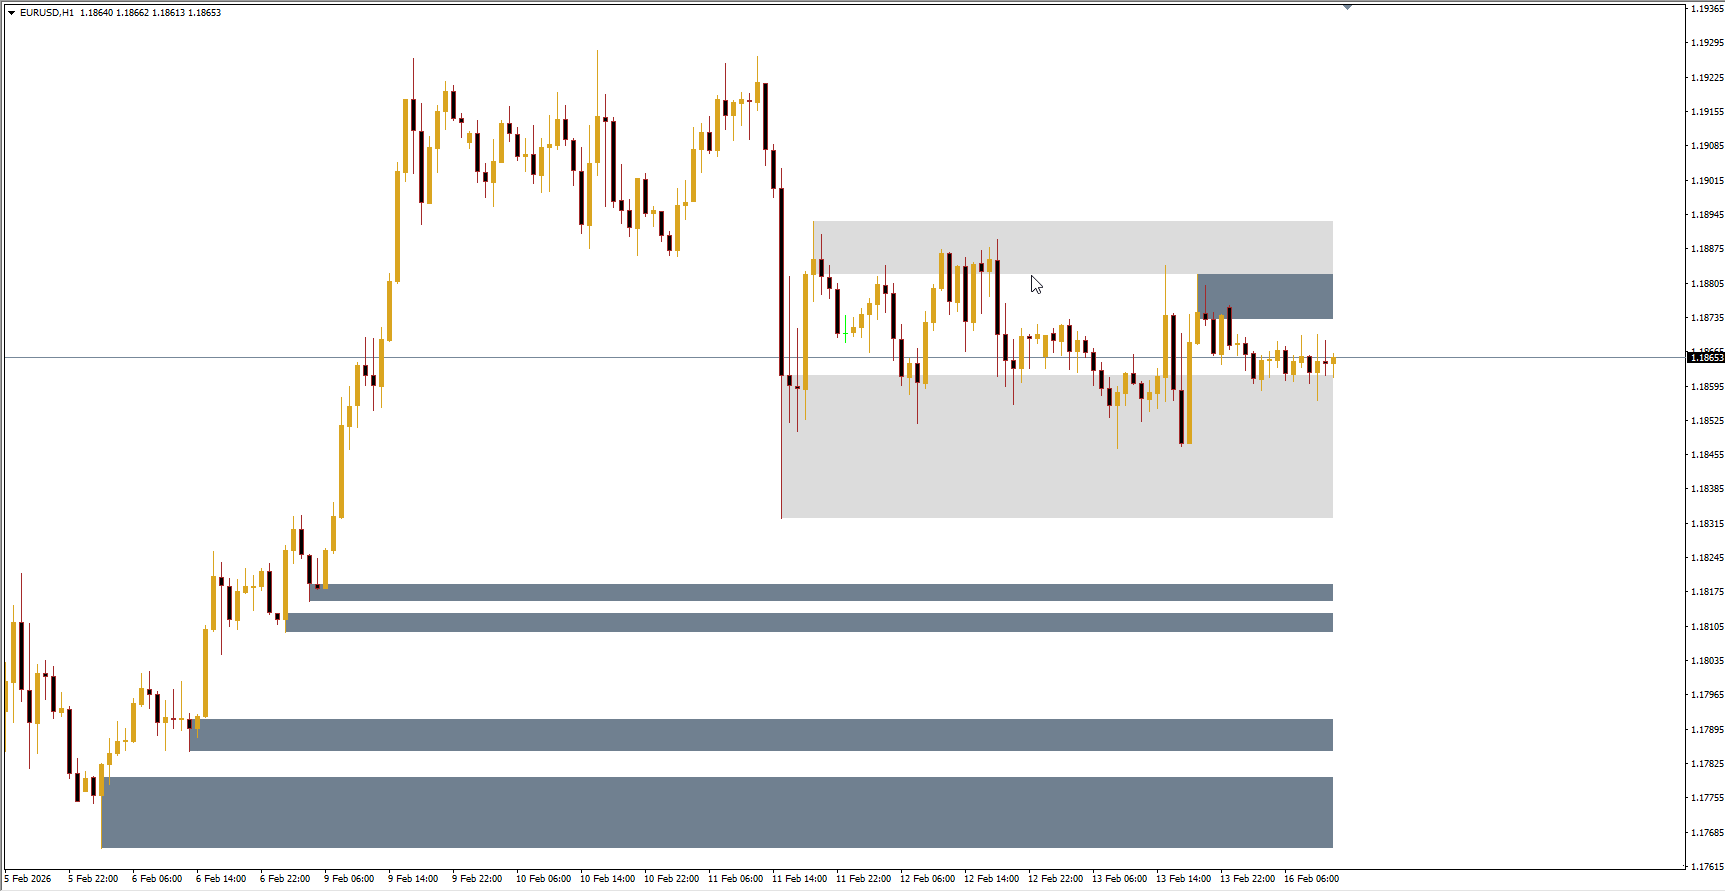
The Supply and Demand Zones Indicator accurately identifies key zones for any currency pair on your MT4 chart:
White zones: Recently retouched and tested zones – more reliable for trading
Grey zones: Untouched zones – useful for observing potential future levels
Some indicator settings also allow traders to display Fibonacci retracement levels between zones, adding further analytical power.
How to Use the Supply and Demand Zones Indicator
Since supply and demand zones function similarly to Support And Resistance, they can be used in the same way:
Supply zones: Price often hits and bounces down → consider sell trades
Demand zones: Price hits and bounces up → consider buy trades
Trading tip: Only trust the retouched white zones. These have been tested at least twice, making them more reliable than untouched grey zones.
Who Can Benefit From This Indicator?
Beginner traders: Helps recognize support and resistance without manual drawing
Experienced traders: Can use as confirmation alongside their own drawn zones
While pro traders may have their own methods for drawing zones, the accuracy and automatic plotting of this indicator make it a valuable tool for any trader using supply and demand strategies.
Understanding Supply and Demand Zones
Construction
Demand Zones: Formed where price sharply rises → strong buying interest → triggers buying when revisited
Supply Zones: Formed where price sharply drops → strong selling pressure → sellers react when revisited
Types
Fresh Zones: Recently formed, untested, strong due to unfilled orders
Tested Zones: Price has interacted with them before; still relevant but may weaken over time
Differences From Support and Resistance
Feature
Supply & Demand Zones
Support & Resistance
Range
Covers broader price areas
Specific price points
Basis
Market volume and movement
Historical price touches
Duration
Often relevant long-term
Better for short-term trades
Pros and Cons
Pros:
High accuracy → reliable entry/exit points
Longevity → zones remain relevant over time
Cons:
More complex to interpret without indicators
Broader zones may create ambiguity in precise entry timing
Bottom Line
The Supply and Demand Zones Indicator for MT4 is an essential tool for any forex trader looking to simplify trading decisions. By automatically highlighting tested and untested zones, it helps traders identify reliable areas for entries, exits, and market analysis. Beginners and experienced traders alike can benefit from its accuracy and visual clarity.
FAQ
12 Downloads
Last Update:
Feb 16, 2026 08:55 AM
Published:
Feb 16, 2026 05:24 AM
Category: