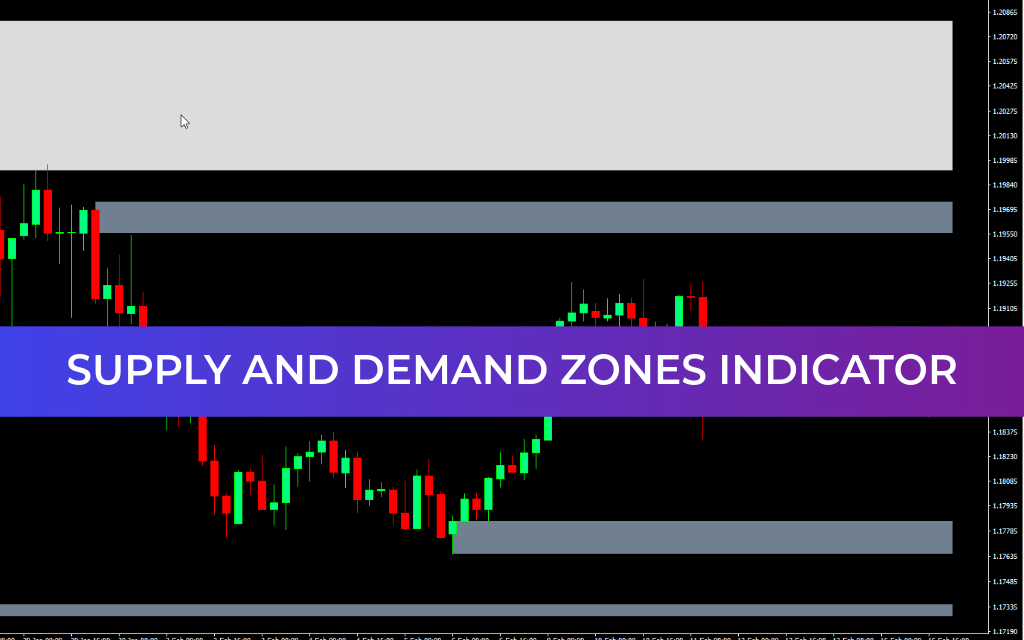
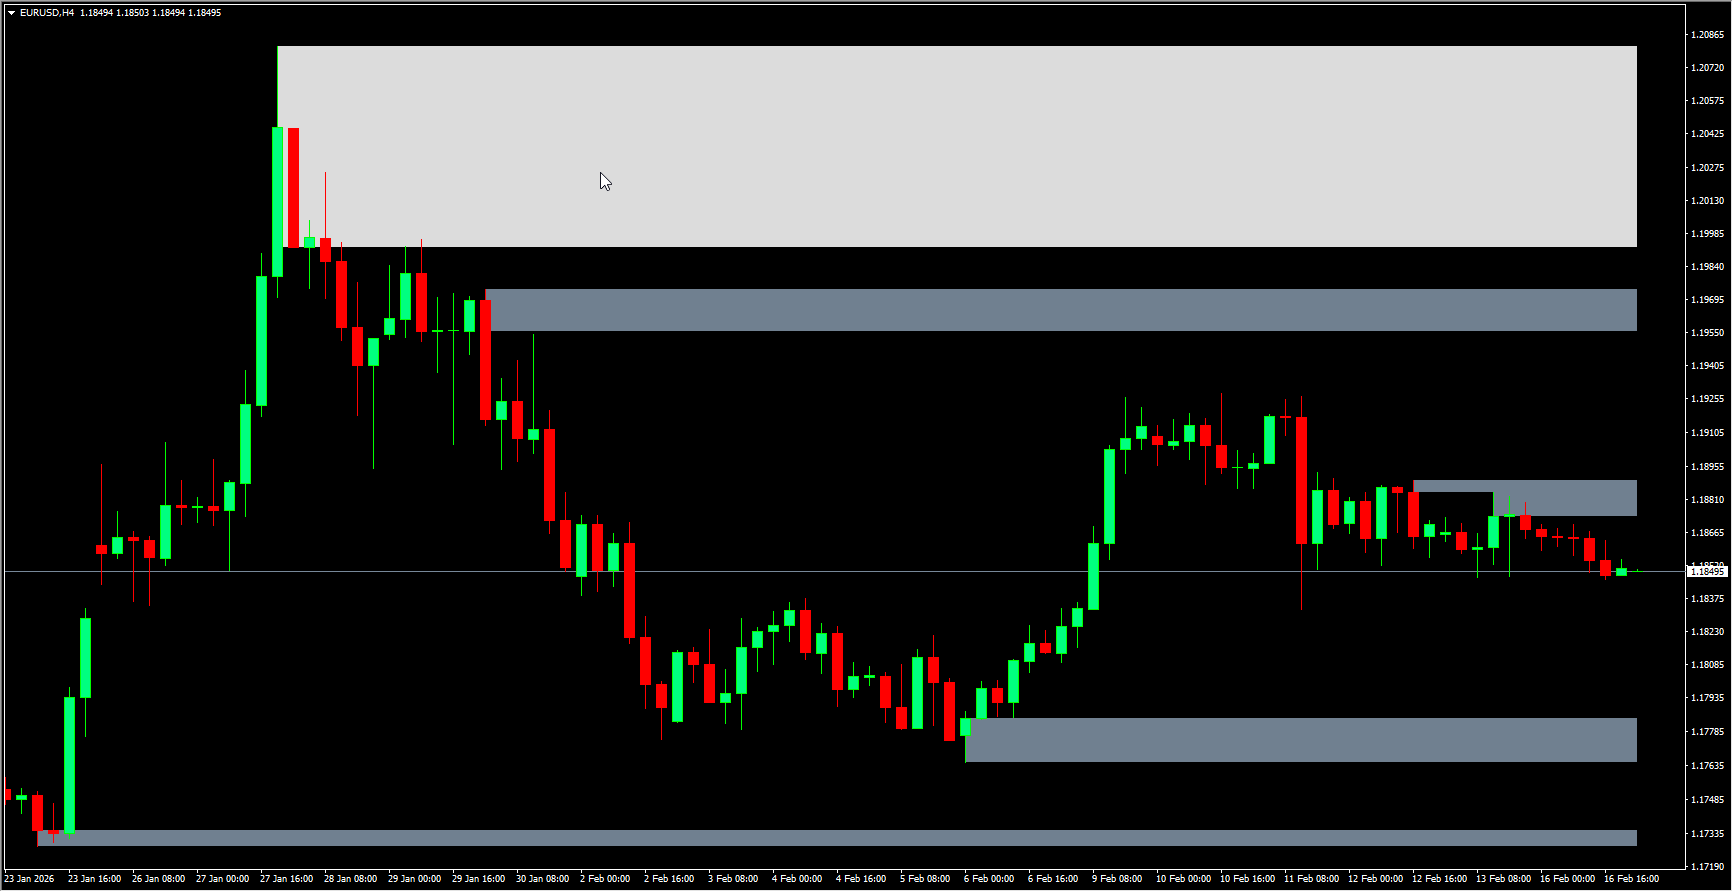
The Supply And Demand Zones Indicator automatically plots supply and demand zones on the MT4 chart:
White zones: Retouched zones that have been tested by price at least twice, making them more reliable for trading.
Grey zones: Untested or fresh zones that show potential future price reactions.
Additionally, the indicator allows traders to display Fibonacci retracements between zones, providing further insight into potential entry and exit points.
How to Trade Using the Supply and Demand Zones Indicator
Trading Principles
Buy at demand zones: When price reaches a demand zone, buying interest is likely to increase, leading to upward price movement.
Sell at supply zones: When price reaches a supply zone, selling pressure is likely to increase, causing downward movement.
Focus on retouched zones: White zones are more reliable since they have been tested at least twice. Grey zones are best used for observing potential future levels.
Additional Considerations
Use supply and demand zones as dynamic support and resistance levels.
Combine the indicator with other technical tools such as trendlines, Price Action, or moving averages to confirm trade entries and exits.
Fresh zones often indicate unfilled orders and can be strong trading areas, while tested zones remain relevant but may gradually lose strength.
Understanding Supply and Demand Zones
Demand Zones
Formed where price sharply rises due to strong buying activity.
When revisited, these zones often trigger renewed buying pressure.
Supply Zones
Formed where price sharply falls due to strong selling activity.
Sellers often re-enter the market when price returns to these zones.
Types of Zones
Fresh zones: Recently formed and untested, considered stronger due to unfilled orders.
Tested zones: Price has already reacted to these zones; they are still relevant but may weaken over time.
Difference from Support and Resistance Levels
Supply and demand zones cover broader price ranges and reflect actual market volume and momentum. They are more suitable for long-term analysis.
Support and resistance levels are specific price points based on historical touches, generally better suited for short-term trading.
Pros and Cons
Pros
High accuracy: Entry and exit points are based on actual market activity.
Longevity: Zones remain relevant over time, useful for long-term planning.
Cons
Complexity: Harder to identify manually without an indicator.
Ambiguity: Broader zones may create uncertainty in exact entry timing.
Who is the Supply and Demand Zones Indicator Best For?
The indicator is useful for all Forex traders:
Beginners: Helps quickly identify key market levels and understand support and resistance concepts.
Experienced traders: Can complement existing trading strategies, especially when historical supply and demand zones are difficult to track manually.
Conclusion
The Supply and Demand Zones Indicator for MT4 simplifies a critical part of Forex trading. By automatically highlighting historical and potential supply and demand areas, it allows traders to make more informed decisions, identify reliable trade setups, and improve their risk management strategies. Using the indicator in combination with other tools enhances trading accuracy and confidence.
FAQ
9 Downloads
Published:
Feb 16, 2026 17:28 PM
Category: