The RSI Heatmap MT4 Indicator is a powerful tool for forex traders looking to assess the strength of currency pairs in real time. By combining the Relative Strength Index (RSI) with a visual heatmap, this currency strength meter provides clear and accurate insights into market momentum across multiple currencies and timeframes. The indicator is especially useful for traders who rely on currency strength analysis as part of their trading strategy.
How It Works
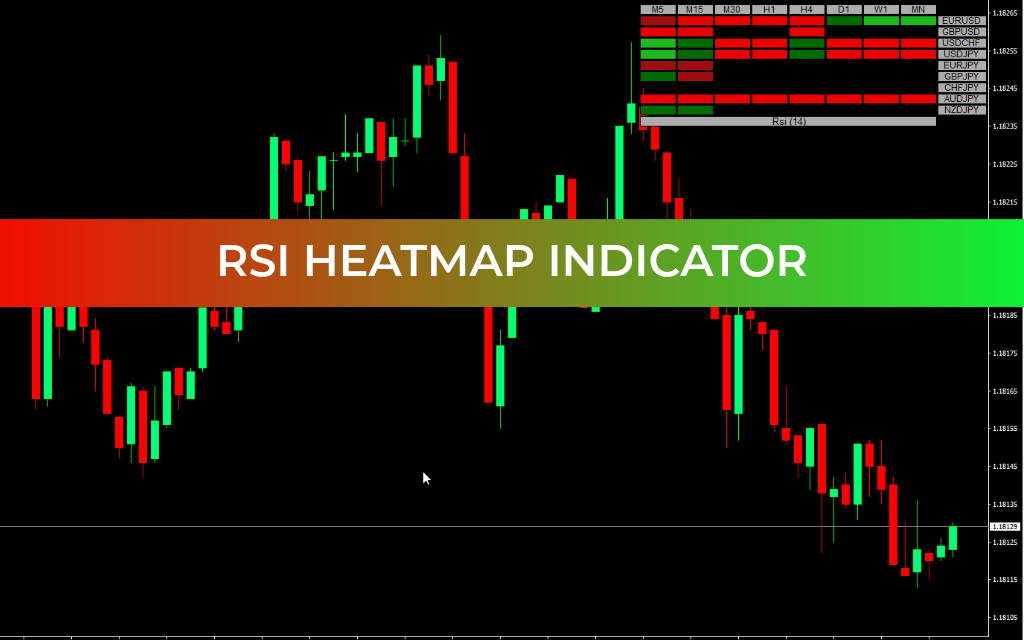
The RSI Heatmap uses color-coded signals to represent currency strength:
Green to Lime Green: Indicates a currency is gaining strength — potential Buy opportunity.
Firebrick to Red: Indicates a currency is weakening — potential Sell opportunity.
By monitoring color changes across multiple timeframes, traders can confirm stronger signals and increase confidence in their trades.
Multi-Timeframe Analysis
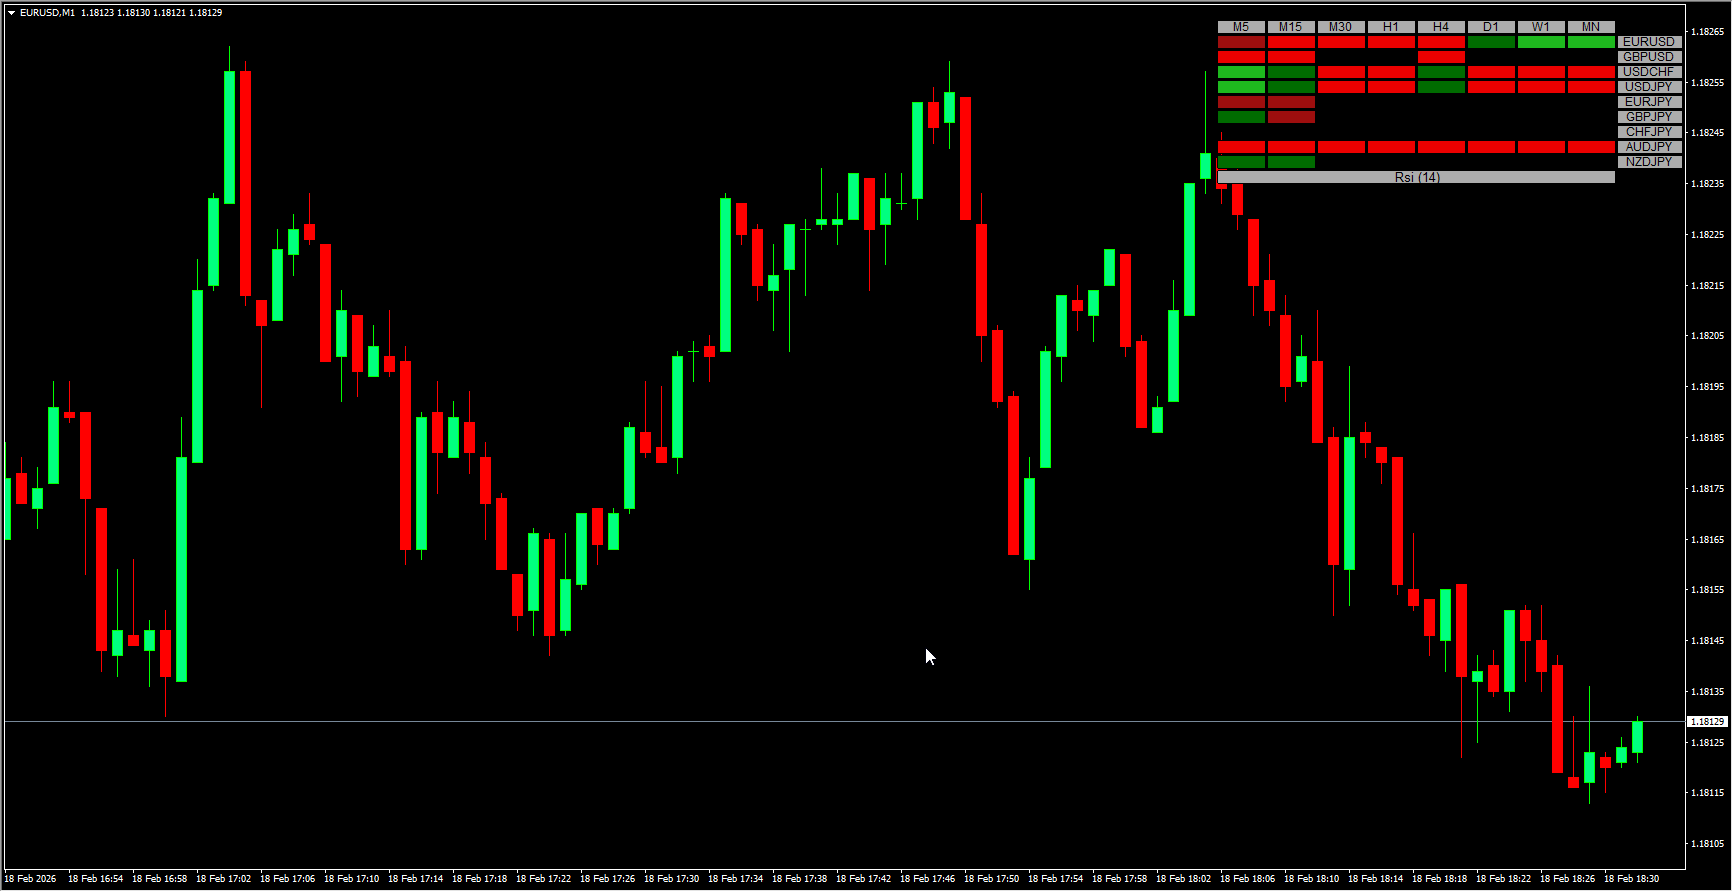
Traders can track currency strength across different timeframes to identify alignment and trend consistency:
Place Buy orders when the strength indicator turns positive across several timeframes.
Place Sell orders when weakness is consistent across multiple timeframes.
Additionally, traders can filter pairs containing a specific currency (e.g., GBP) to analyze its relative strength compared to other currencies in real time.
Benefits
Accurate Currency Strength: RSI calculation provides precise measurement of market momentum.
Heatmap Visualization: Simplifies monitoring of multiple currencies simultaneously.
Multi-Timeframe Confirmation: Increases reliability of trade entries and exits.
User-Friendly: Easy to interpret for both novice and experienced traders.
Conclusion
The RSI Heatmap MT4 Indicator is an essential tool for forex traders focused on currency strength strategies. By combining RSI-based calculations with a visual heatmap, it allows traders to quickly interpret market conditions, identify strong and weak currencies, and execute more informed trades. Its multi-timeframe functionality and real-time updates make it an invaluable addition to any trading toolkit.
FAQ
2 Downloads
Published:
Feb 18, 2026 11:35 AM
Category: