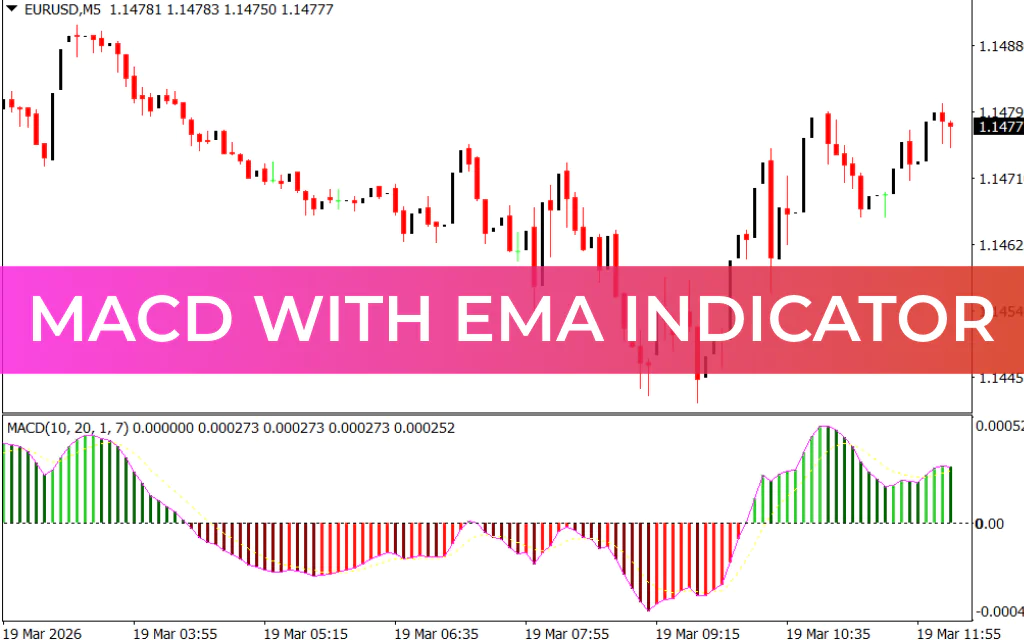
The MACD with EMA Indicator for MT4 combines two of the most powerful technical tools—Moving Average Convergence Divergence (MACD) and Exponential Moving Averages (EMA)—to deliver accurate trend direction and momentum signals.
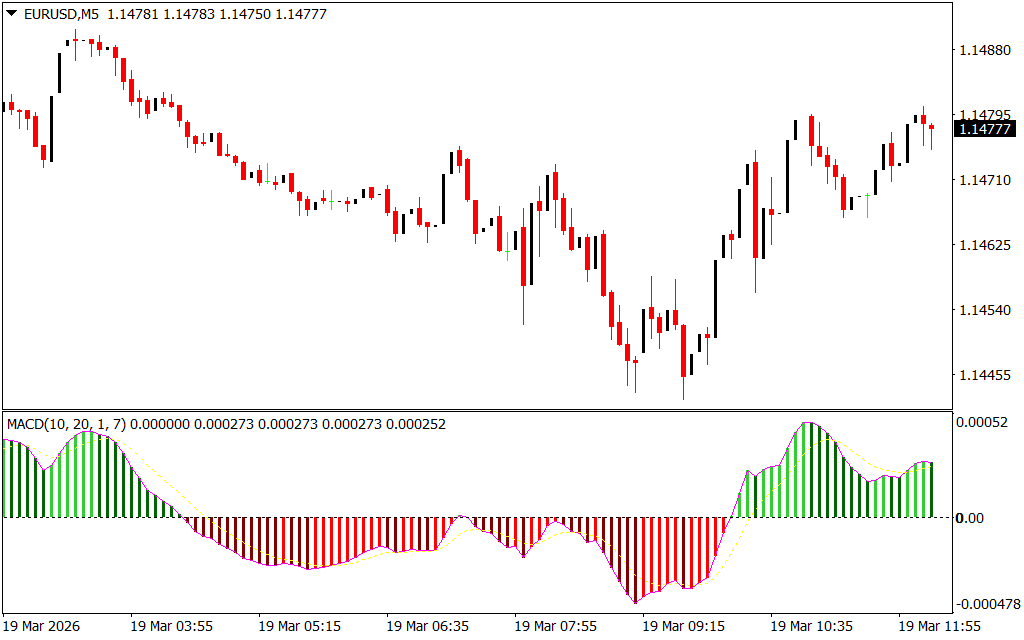
By merging these indicators, traders can easily identify BUY and SELL opportunities, along with potential trend reversals and continuations.
Key Features of MACD with EMA Indicator
- Dual EMA System: Uses fast and slow EMAs for trend calculation
- MACD Signal Line: Generates clear BUY and SELL signals
- Histogram Visualization: Displays market momentum with color-coded bars
- Divergence Detection: Helps identify potential reversals
- Multi-Timeframe Compatibility: Works across all MT4 charts
For best results, traders are encouraged to use this indicator on higher timeframes, where signals tend to be more reliable and less noisy.
How the MACD with EMA Indicator Works
The indicator is built using:
- Fast EMA: Reacts quickly to price changes
- Slow EMA: Tracks the broader trend
- MACD Signal Line: Derived from the difference between the two EMAs
- Histogram: Visual representation of momentum
Histogram Interpretation
- Green Bars: Indicate bullish momentum
- Red Bars: Indicate bearish momentum
The histogram helps traders quickly understand whether the market is trending upward or downward.
Trading Strategies Using MACD with EMA
Bullish Strategy (BUY Trade)
- Histogram begins to show red bars fading into green
- Price momentum shifts toward an uptrend
- Bars move above the signal line
- Enter a BUY trade
- Place stop-loss below recent swing low
- Exit when momentum weakens or reverses
Bearish Strategy (SELL Trade)
- Histogram transitions from green to red bars
- Indicates potential downtrend
- Bars move below the signal line
- Enter a SELL trade
- Place stop-loss above recent swing high
- Take profit when trend weakens or reverses
Understanding Signal Line & Histogram
- Above Signal Line: Bullish Trend Confirmation
- Below Signal Line: Bearish trend confirmation
- Histogram Divergence: Signals possible Trend Reversal
Combining both elements provides a more complete picture of market momentum and direction.
Frequently Asked Questions (FAQ)
Does MACD use EMA or SMA?
The MACD with EMA Indicator uses Exponential Moving Averages (EMA) for faster and more responsive signals.
Are EMA and MACD the same?
No. EMA is a single moving average line, while MACD combines EMAs and displays both a signal line and histogram for deeper analysis.
Conclusion
The MACD with EMA Indicator for MT4 is a powerful and reliable tool for identifying trend direction, momentum, and reversal signals. By combining EMAs with MACD analysis, it provides traders with a comprehensive view of market conditions.
For optimal results, traders should use it alongside Support And Resistance levels, trendlines, and Price Action strategies. This indicator is free to download and suitable for traders of all experience levels.
FAQ
4 Downloads
Published:
Mar 19, 2026 07:18 AM
Category: