Have you ever heard the phrase “always trade with the trend” but struggled to determine whether the market is actually trending up or down? Many traders face this challenge. The Keltner Channel (KC) Indicator for MT4 is designed to solve exactly that problem.
It helps traders identify trends, potential reversals, and breakout opportunities using a simple channel structure around price.
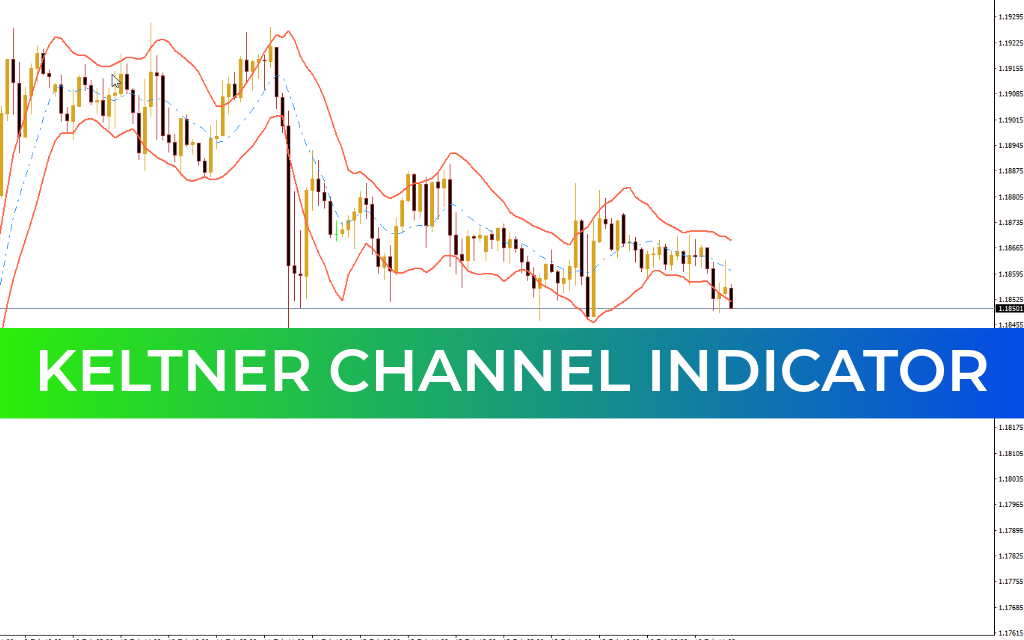
What Is the Keltner Channel Indicator?
The Keltner Channel consists of three bands plotted around price:
Upper band
Middle band
Lower band
Price typically moves within these bands, oscillating between the upper and lower boundaries depending on market momentum and volatility.
Why Traders Use the Keltner Channel
The Keltner Channel offers several important advantages:
1. Trend Identification
An upward-sloping channel indicates an uptrend
A downward-sloping channel indicates a downtrend
2. Reversal Detection
It can signal when a trend is losing strength and may reverse.
3. Breakout Confirmation
Price closing outside the channel often signals strong momentum and potential continuation.
4. Reduced False Signals
Compared to similar tools like Bollinger Bands, the Keltner Channel is less sensitive to sudden price spikes at default settings. This makes it more resistant to false breakouts.
Traders can adjust the settings to make the channel more responsive or smoother, depending on their strategy.
How the Keltner Channel Is Calculated
The indicator is based on two key components:
EMA (Exponential Moving Average) – tracks recent price changes
ATR (Average True Range) – measures market volatility
Formula
Upper Band: EMA + (Multiplier × ATR)
Lower Band: EMA − (Multiplier × ATR)
Middle Band: EMA
Default Settings
EMA period: 20
ATR period: 10
Multiplier: 2
A higher EMA period creates a smoother, slower channel. A lower EMA makes it more responsive.
A larger multiplier widens the channel, while a smaller multiplier narrows it.
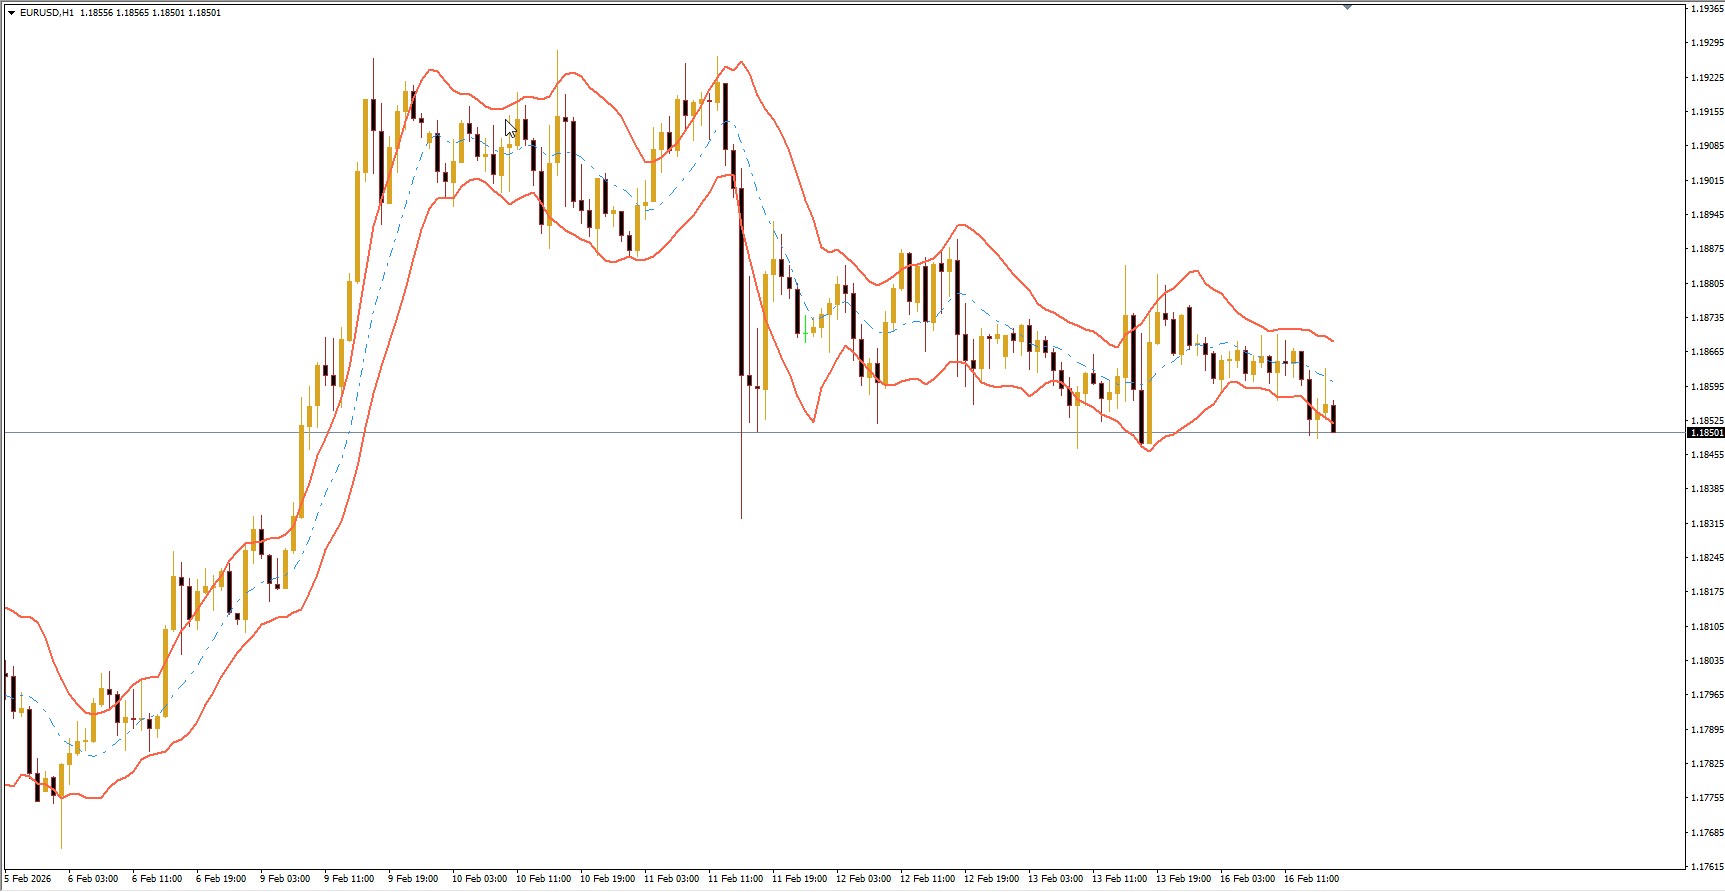
How to Trade Using the Keltner Channel
1. Dynamic Support and Resistance
The channel acts as a moving Support And Resistance system.
Uptrend conditions:
Price stays in the upper half of the channel
Often bounces between middle and upper band
Downtrend conditions:
Price stays in the lower half
Often moves between middle and lower band
Trade in the direction of the channel slope.
2. Breakout Trading
When price opens inside the channel but closes outside it, this signals strong momentum.
Breakouts often lead to:
Short-term continuation moves
Start of major trends
Traders typically enter in the direction of the breakout.
3. Trend Reversal Signals
Momentum loss can hint at reversals.
Possible uptrend exhaustion:
Price repeatedly touches the upper band
Eventually drops toward the lower band
Possible downtrend exhaustion:
Price repeatedly hits the lower band
Moves strongly toward the upper band
These shifts may signal trend change.
Who Should Use the Keltner Channel?
This indicator is ideal for:
Beginners learning to identify trends
Trend-following traders
Reversal traders
Breakout traders
Because it provides clear visual structure, it’s especially helpful for traders who struggle to interpret market direction.
Bottom Line
The Keltner Channel Indicator is a powerful and versatile trend tool. It helps traders:
Identify trend direction
Spot breakouts
Detect potential reversals
Trade dynamic support and resistance
Its balanced sensitivity and clear visual signals make it suitable for both beginners and experienced traders.
If you want a simple way to understand Market Structure and trade with the trend, the Keltner Channel is an excellent addition to your MT4 toolkit.
FAQ
1 Download
Last Update:
Feb 16, 2026 15:32 PM
Published:
Feb 16, 2026 11:33 AM
Category: