Price Action analysis uses only raw price data to interpret market behavior. This approach emphasizes understanding the motives of buyers and sellers through patterns formed on candlestick charts. Unlike traditional indicators or Expert Advisors that generate signals based on calculations of price and volume, Price Action allows traders to read the market directly.
While both approaches can be effective, MT4 lacks native tools for Price Action analysis. The PriceActionScaner indicator addresses this limitation by providing visual cues for key price patterns, making it easier to anticipate trend continuations and reversals.
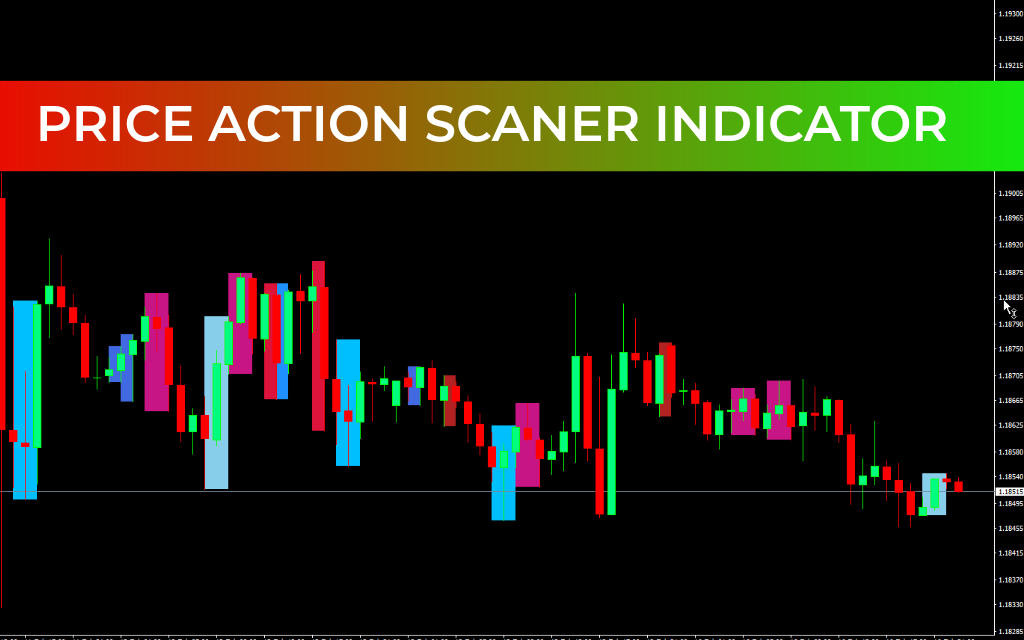
PriceActionScaner Indicator and Features
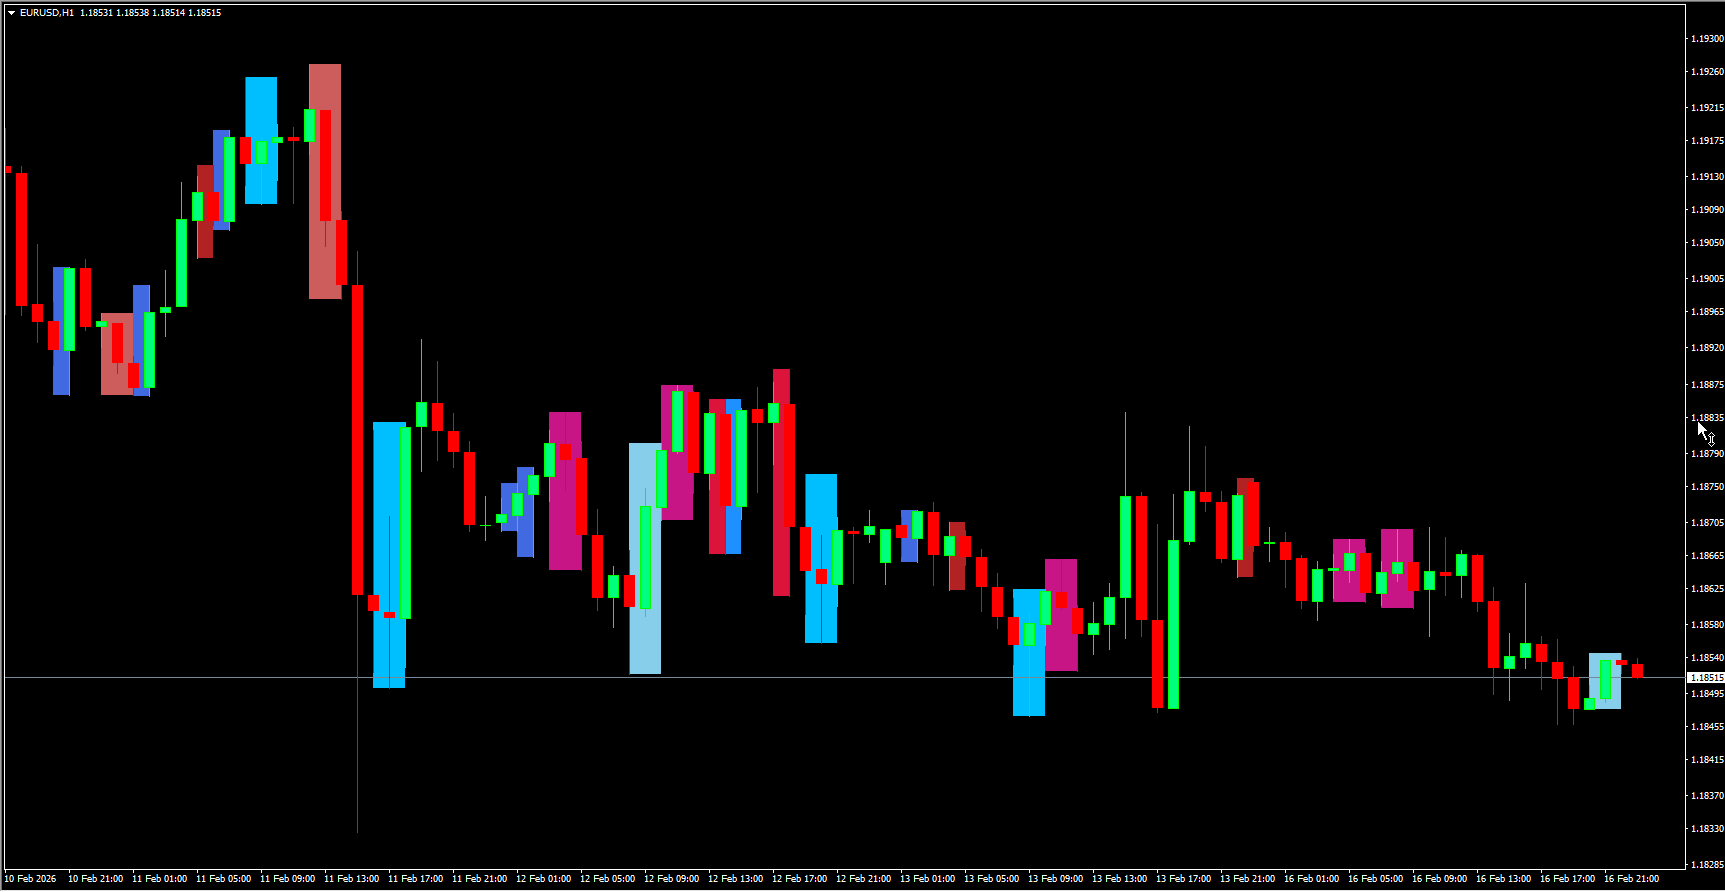
PriceActionScaner automatically scans the chart of the selected asset and plots seven common Price Action patterns across all timeframes. Higher timeframes provide more accurate signals because they filter out market noise.
The main patterns identified by the indicator include:
DBHLC & DBLHC Pattern (Double Bar Highs Lower Close / Double Bar Lows Higher Close)
This pattern consists of two candlesticks with matching highs or lows, where the second candle closes higher or lower than the first. It typically signals a continuation of the existing trend during strong market movements.
TBH & TBL Pattern (Two Bars High / Two Bars Low)
This occurs when two candlesticks share the same high or low, often appearing at price extremes when a trend shift is taking place. It signals that the momentum of buyers or sellers may be weakening.
RAIL Pattern
Appearing during strong trends, this formation can act as either a continuation or completion signal depending on its chart position. It requires long candlestick bodies with short shadows, indicating high trading activity and potentially reliable signals.
OVB Pattern (Engulfing Bullish / Bearish)
This consists of two candlesticks where the second candle fully engulfs the body of the first. A bullish Engulfing Pattern signals potential upward momentum, while a bearish pattern indicates possible downward movement.
PPR Pattern (Reversal Pivot Point)
Made up of three candlesticks, this pattern often indicates a potential Trend Reversal rather than continuation. The third candlestick forms a new extreme without closing beyond the previous candle’s body.
Pin-Bar Pattern
Characterized by a long shadow with closely aligned opening and closing prices, the pin bar frequently signals trend reversals. It is simple to identify and widely used by Forex traders.
WRB Pattern (Wide Range Bar)
This pattern highlights two large bullish or bearish candlesticks, usually forming at the end of a retracement. It signals a resumption of the dominant trend and can serve as a confirmation for trend-following strategies.
Practical Use
PriceActionScaner works best when combined with other analysis tools or as part of a broader trading system. By plotting formations across all timeframes, it provides insights that are applicable to swing trading, intraday trading, and scalping. The indicator is particularly helpful for confirming Support And Resistance zones, trendlines, and potential reversal points.
Initial setup requires customizing parameters to match your trading style, after which the indicator becomes a versatile and adaptable tool for identifying high-probability trade opportunities.
FAQ
8 Downloads
Published:
Feb 16, 2026 16:43 PM
Category: