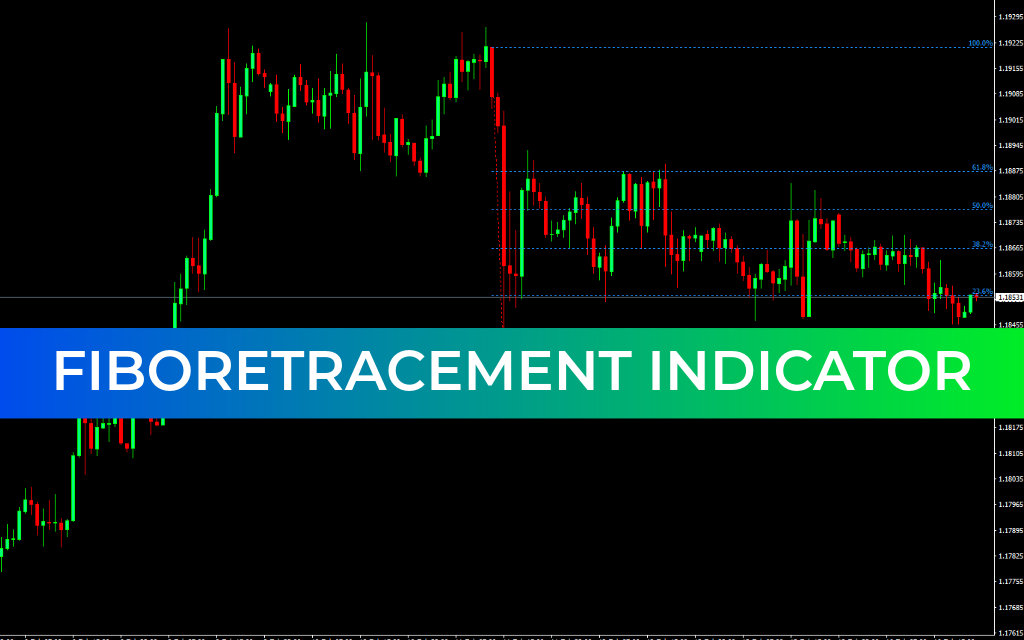
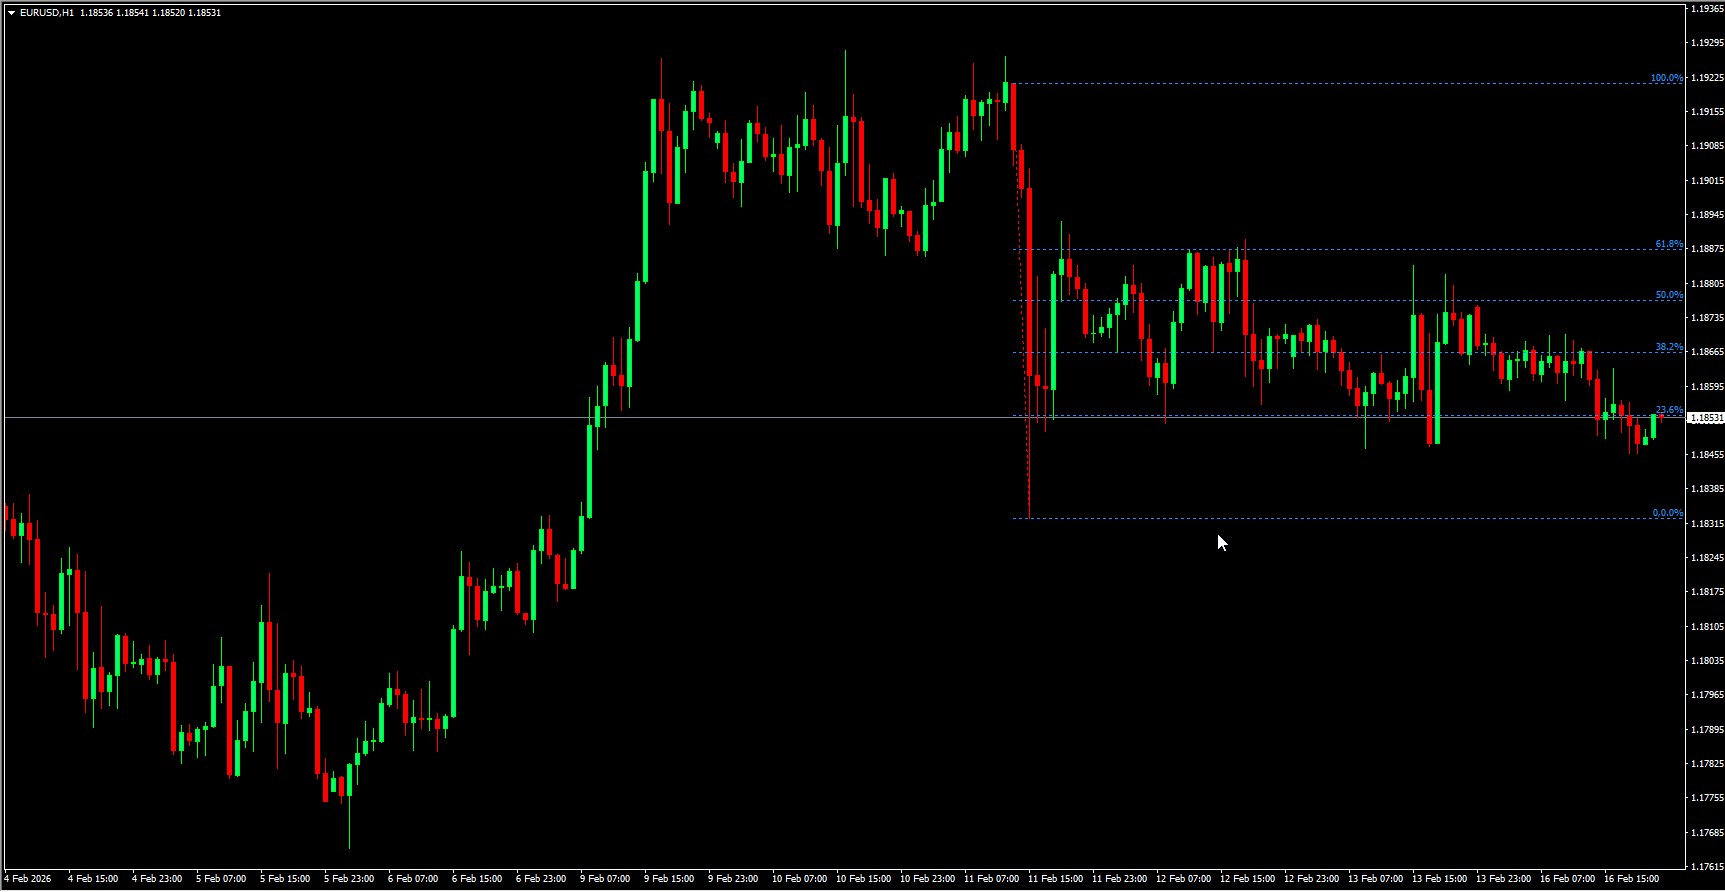
In the Forex market, strong volatility often makes it difficult to distinguish between genuine trend waves and temporary retracement movements. Traders frequently confuse pullbacks with reversals or miss continuation opportunities because price fluctuations can appear similar in fast-moving conditions. To address this challenge, a free Fibonacci Retracement indicator was developed that automatically identifies meaningful price movements and plots key retracement levels directly on the trading chart.
This tool helps traders focus on active market phases while filtering out flat or sideways Price Action. By doing so, it highlights only the most relevant retracement zones where price is more likely to react and continue moving in the direction of the dominant trend.
The main purpose of the indicator is to estimate how deep a pullback may go and to identify potential pivot zones where the primary trend is likely to resume. The deeper the retracement within a trend, the higher the probability that price will form a turning point before continuing in the prevailing direction. This makes the indicator particularly useful for timing entries after temporary corrections.
Understanding the Fibonacci Levels
The indicator displays Fibonacci retracement levels as percentage values that represent how much of the prior price movement has been retraced. These levels serve as potential reaction zones where price may slow, reverse, or consolidate.
The golden ratio level is widely considered the most important and influential. When price pauses or reverses near this level — especially when combined with nearby retracement zones — the probability of trend continuation increases significantly.
Another commonly observed level acts as a psychological midpoint of a price move. Many traders close positions here, which often creates strong price reactions and potential pivot formation.
Shallower retracement zones typically indicate strong trend momentum. When price reverses early during a pullback, it suggests high confidence among market participants and strong directional pressure.
Very shallow retracements rarely produce major turning points because traders usually prefer deeper corrections before entering positions. This reflects the natural tendency of the market to test stronger support or resistance before continuing.
Some Fibonacci tools include deeper retracement levels, but in practice, price often resumes its trend before reaching extreme pullback zones. For this reason, certain deeper levels are sometimes excluded to reduce unnecessary signals and keep the focus on higher-probability reaction areas.
Interpreting Market Structure Through Retracements
The relationship between the strength of the main trend and the depth of the pullback provides valuable insight into market behavior.
When a strong trend is followed by a weak retracement, continuation is more likely because momentum remains dominant. On the other hand, if pullbacks become stronger than the original trend movement, the market may be transitioning into a new direction rather than simply correcting.
Retracement levels become even more reliable when they align with other technical elements such as Support And Resistance zones, round price levels, or trendlines. This alignment creates confluence, which significantly increases the probability of meaningful price reactions.
Practical Application in Trading
The Fibonacci Retracement indicator is most effective when used as part of a broader trading system rather than as a standalone tool. Combining it with additional technical analysis methods helps confirm signals and improves decision-making.
Trendlines are commonly used alongside Fibonacci levels. When a pullback slows or stalls near a key retracement zone, this may signal a potential pivot and continuation of the primary trend. Confirmation from price structure or trendline interaction strengthens the reliability of the setup.
In bearish conditions, if price retraces deeply and begins to stall near strong retracement zones, traders often watch for renewed downward momentum before entering sell positions. Risk management typically involves placing protective stops beyond structural boundaries such as trendlines or resistance areas.
In bullish conditions, if price retraces only modestly and resumes upward movement quickly, it suggests strong buying pressure and optimistic market sentiment. In such situations, entries are often taken once upward momentum is confirmed, with protective stops placed beyond nearby support levels.
Timeframe Considerations
When switching between timeframes, the indicator may not automatically update its levels. Reapplying the indicator allows it to recalculate based on the selected timeframe, ensuring accurate retracement placement.
Key Benefits
The Fibonacci Retracement indicator is adaptable to various trading styles, including Scalping, intraday trading, and long-term strategies. It helps traders identify potential turning points after pullbacks, evaluate market sentiment, and anticipate likely price movement with greater confidence.
By providing a structured way to measure corrections within trends, the indicator enhances trade timing, improves risk management, and supports more disciplined technical analysis.
FAQ
1 Download
Last Update:
Feb 16, 2026 16:38 PM
Published:
Feb 16, 2026 15:24 PM
Category: