Supply And Demand zones are price levels where increased market activity has previously been observed. These levels are significant because repeated interactions with them often create high-probability trading opportunities.
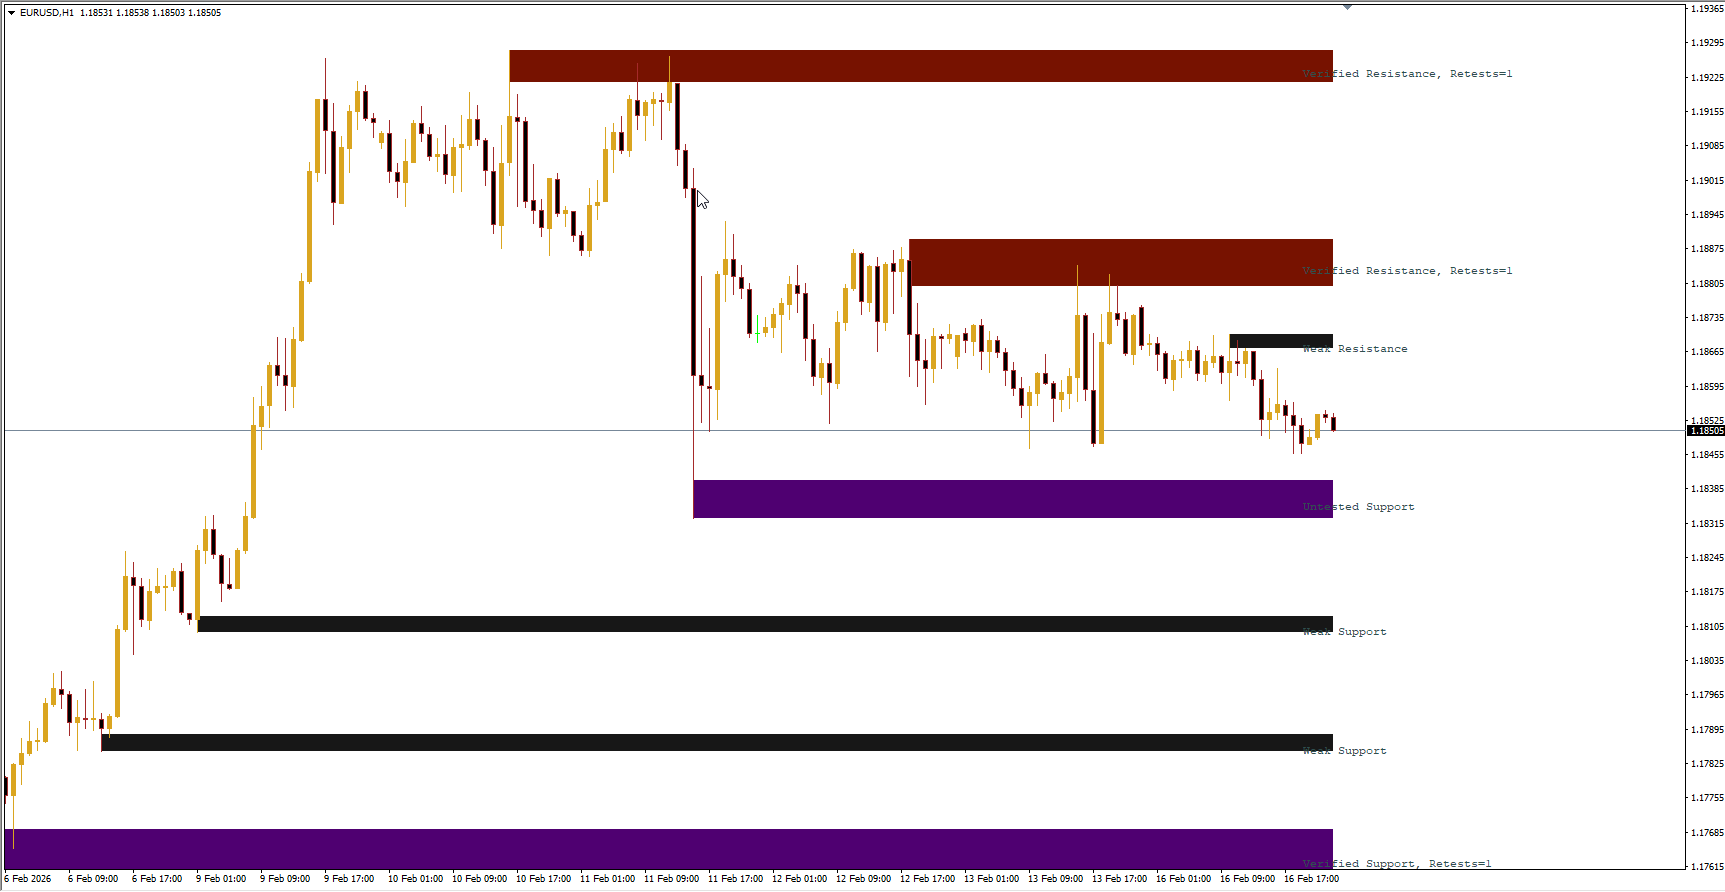
The indicator draws levels based on supply and demand zones that have already triggered strong, targeted price movements. The height of each zone reflects its significance—the more frequently a level has influenced price, the larger it appears on the chart.
Each zone is accompanied by a brief description to make it easy to understand its meaning and relevance. Higher timeframe charts provide more reliable signals, as lower timeframes are often affected by market noise. The more a price level has been tested, the stronger and more actionable it becomes.
Types of Zones Plotted by the Indicator
The Shved Supply & Demand indicator highlights five types of zones:
Weak Zone
These levels show minimal supply or demand and are less reliable. Traders should avoid these zones or approach them cautiously.
Untested Zone
A zone from which price has previously made a strong, targeted move but has not been retested. It represents potential interest for future trading activity.
Verified Zone
A zone that has been tested two or more times. The indicator shows the number of retests, and zones with more retests are stronger and more significant.
Proven Zone
A repeatedly tested zone where trading activity almost always resumes. Even if a level is broken, it often serves as a basis for trend continuation or reversal.
Turncoat Zone
Also called mirror levels, these zones initially act as resistance or support but can reverse roles once broken due to shifts in supply and demand.
How to Use the Shved Supply & Demand Indicator
The indicator can be applied in two main ways: trading during a trend change or trading along the main trend.
Trading During a Trend Change
In a scenario where a downtrend changes to an uptrend, the indicator works as follows:
The first strong rally wave creates an “Untested” zone.
The second upward move increases the interest in the zone, upgrading it to “Verified.”
After a third rally wave, the level becomes “Proven.”
Future approaches to this zone can serve as Buy entry points.
Pending Stop Loss orders should be placed strategically near these zones.
Trading Along the Main Trend
For a downtrend with retracement rally waves:
A retracement creates a temporary upward movement relative to the main trend.
The first sell-off below the previous low signals sellers’ strength, marking a potential Sell zone.
Subsequent sell-off waves provide opportunities for market entries.
Pending Stop Loss orders can be placed beyond the identified zone.
While the indicator highlights important trading zones, combining it with other analysis tools or Price Action strategies enhances its efficiency. Using it alongside other indicators or trading systems that rely on candlestick patterns and price behavior increases the probability of successful trades.
No matter your trading style, the Shved Supply & Demand indicator serves as a valuable complement, helping identify levels where price is likely to resume movement and improving overall trade outcomes.
FAQ
1 Download
Published:
Feb 16, 2026 16:49 PM
Category: