The Nice Value Chart Indicator for MetaTrader 4 (MT4) is a technical oscillator designed to detect overbought and oversold zones automatically. It provides traders with visual cues for potential buy and sell opportunities while maintaining a clean, user-friendly display with colorful vertical bars.
How to Install the Nice Value Chart Indicator
- Download the free file “Nice Value Chart 1.0.ex4”.
- Paste it into the Indicators folder of MT4.
- Add the indicator to a chart by either:
- Dragging it from the Navigator window onto the chart.
- Selecting Insert → Indicators → Custom → Nice Value Chart from the MT4 menu.
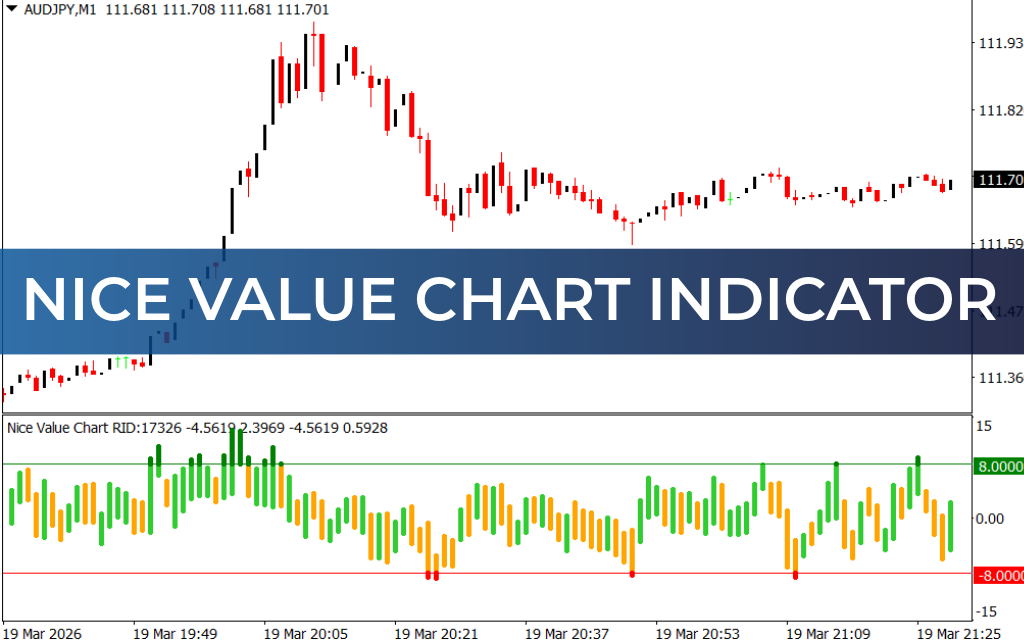
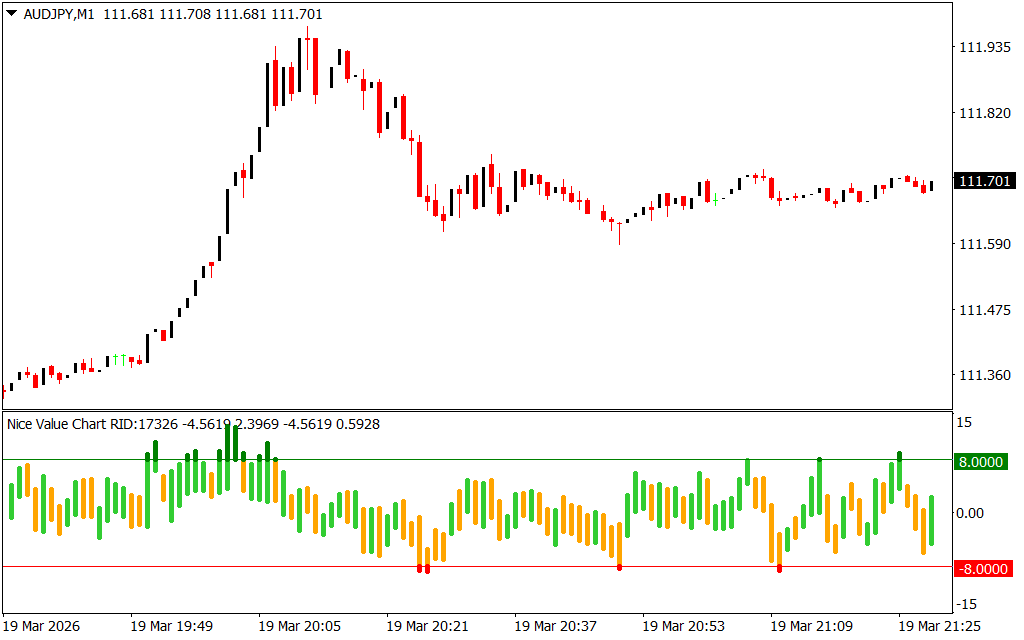
Once added, the indicator displays:
- Four-color vertical bars calculated from price dynamics.
- Two lines marking the overbought and oversold levels.
How to Use the Nice Value Chart Indicator
- Sell Signal: When the indicator rises above the overbought line and the bar turns green, it suggests the price may decrease. Ideal for short positions, especially in a bearish trend.
- Buy Signal: When the indicator falls below the oversold line and the bar turns red, it signals a potential price increase. Optimal when near support levels.
- Divergence Signals: Compare Price Action with indicator movement. Bullish divergences occur when rising lows in the indicator correspond with falling lows in price, signaling potential trend reversals.
Tips for Accuracy
The indicator’s basic signals can sometimes generate false entries. To improve reliability:
- Only buy signals during bullish trends.
- Only sell signals during bearish trends.
- Use additional technical analysis like support/resistance, graphical patterns, or other indicators for confirmation.
Advantages
- Automatic alerts for buy and sell signals.
- Non-repainting and visually clear.
- Applicable across all timeframes and markets, including forex, stocks, and cryptocurrencies.
- Ideal for intraday trading as well as long-term positions.
Disadvantages
- No arrows plotted directly on the chart.
- Exact calculation formula is undisclosed.
- Basic signals may require confirmation for reliable trading decisions.
Conclusion
The Nice Value Chart Indicator for MT4 helps traders buy near lows and sell near highs by identifying overbought and oversold zones. Free to download, it’s suitable for both novice and experienced traders who want a visual and actionable oscillator for multiple markets and timeframes.
FAQ
1 Download
Published:
Mar 19, 2026 16:30 PM
Category: