The Williams %R Indicator for MetaTrader 4 (MT4) is a momentum oscillator that helps traders identify overbought and oversold market conditions. Understanding market momentum is crucial for trend-following strategies, as it allows traders to gauge the bullish or bearish sentiment behind price movements and anticipate upcoming trends.
What Is the Williams %R Indicator?
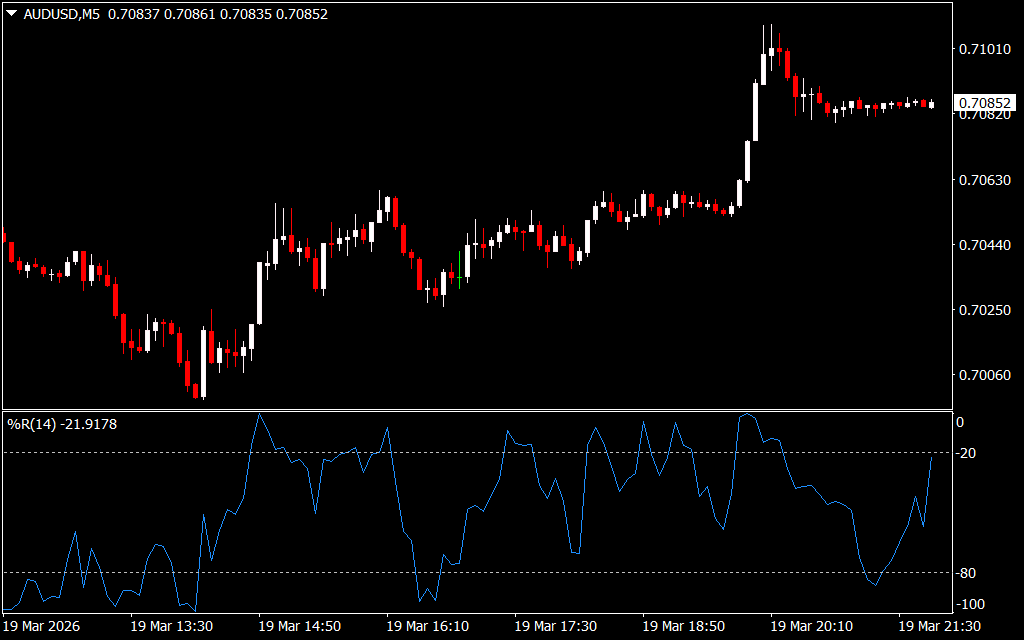
The Williams %R measures the position of the current close relative to the high-low range over a specified period. It fluctuates between 0 and -100 and signals market extremes:
- Overbought: Value rises above -20, indicating the market may be ready for a pullback.
- Oversold: Value drops below -80, suggesting the market may be ready for a bullish reversal.
By combining these readings with Price Action, traders can pinpoint high-probability buy and sell opportunities.
How to Trade With the Williams %R Indicator
- Identify Overbought/Oversold Levels:
- Overbought (-20 and above): Look for bearish price signals such as lower highs, bearish engulfing candles, or trendline resistance.
- Oversold (-80 and below): Look for bullish signals such as higher lows, bullish engulfing candles, or support levels.
- Confirm With Price Action:
- For a BUY trade, wait for the oversold indicator to rise above -80 while the price shows bullish reversal patterns.
- For a SELL trade, wait for the overbought indicator to drop below -20 while the price forms bearish reversal patterns.
- Set Risk Management Levels:
- Place stop-loss orders just beyond recent swing highs or lows.
- Use profit targets aligned with trendlines, support/resistance, or risk-to-reward ratios.
Example Trading Scenario
In the EUR/USD chart:
- The pair was in an uptrend and respecting a trendline support.
- Williams %R dipped below -80, signaling an oversold market.
- A bullish candle formed above the trendline, confirming a long entry.
- As the indicator rose above -80, the price rejoined the overall bullish trend, offering a profitable trade setup.
Conclusion
The Williams %R Indicator for MT4 is a reliable tool for identifying market highs and lows and valid swing levels. It works effectively across intraday, daily, weekly, and monthly charts, making it suitable for both short-term and long-term trading. Beginners and expert traders alike can use this indicator to filter high-probability trading opportunities and align trades with overall market momentum.
FAQ
Published:
Mar 19, 2026 16:56 PM
Category: