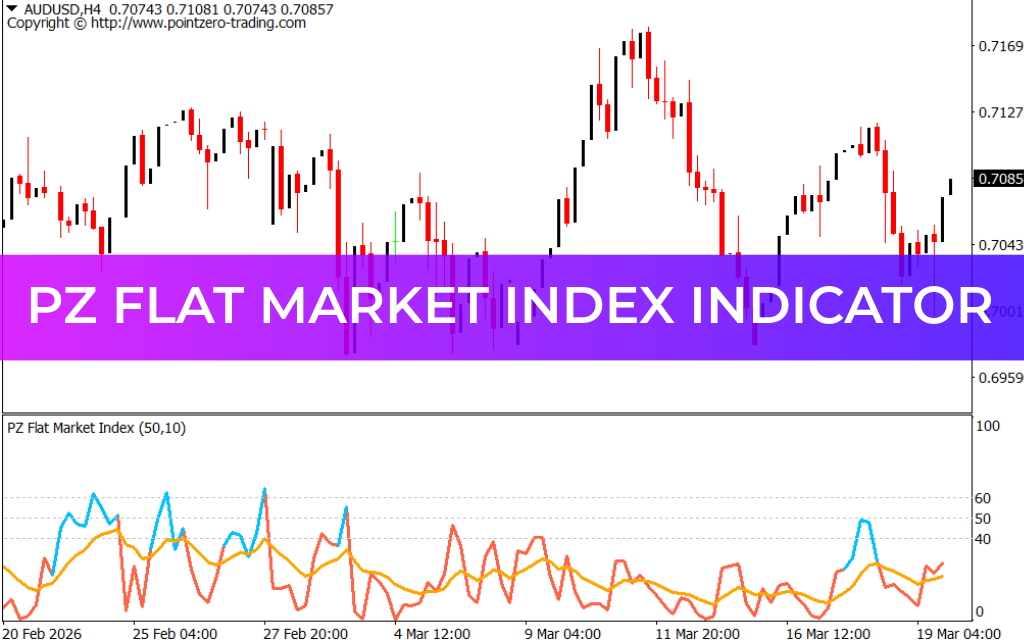
The Pz Flat Market Index Indicator for MetaTrader 4 (MT4) is a momentum oscillator that helps traders determine the direction of the trend using ATR (Average True Range) lines. It works similarly to other oscillators like Stochastics, fluctuating between 0 and 100, and highlights overbought and oversold zones for precise trade entries and exits.
Key Features
- Overbought/Oversold Levels:
- Above 70 → Overbought, indicating a potential reversal of an uptrend.
- Below 30 → Oversold, indicating a potential reversal of a downtrend.
- Neutral Zones: 40, 50, and 60 levels indicate sideways or flat market conditions; avoid trading within these levels.
- ATR Lines: The indicator draws two lines (ATR and ATR multiplier) that fluctuate with different periods. Crossovers of these lines signal stronger trend movements.
- Trend Color Coding: During a downtrend, the ATR line turns red to highlight bearish momentum.
How to Trade with Pz Flat Market Index
- BUY Signal:
- The indicator falls below 30 (oversold).
- Consider entering a long position or exiting short positions.
- SELL Signal:
- The indicator rises above 70 (overbought).
- Consider entering a short position or exiting long positions.
- Avoid Neutral Zones:
- If the indicator fluctuates between 40–60, refrain from trading until a clear trend emerges.
- Signal Confirmation:
- Combine with other tools like Moving Averages or Bollinger Bands for stronger confirmation.
Example Setup
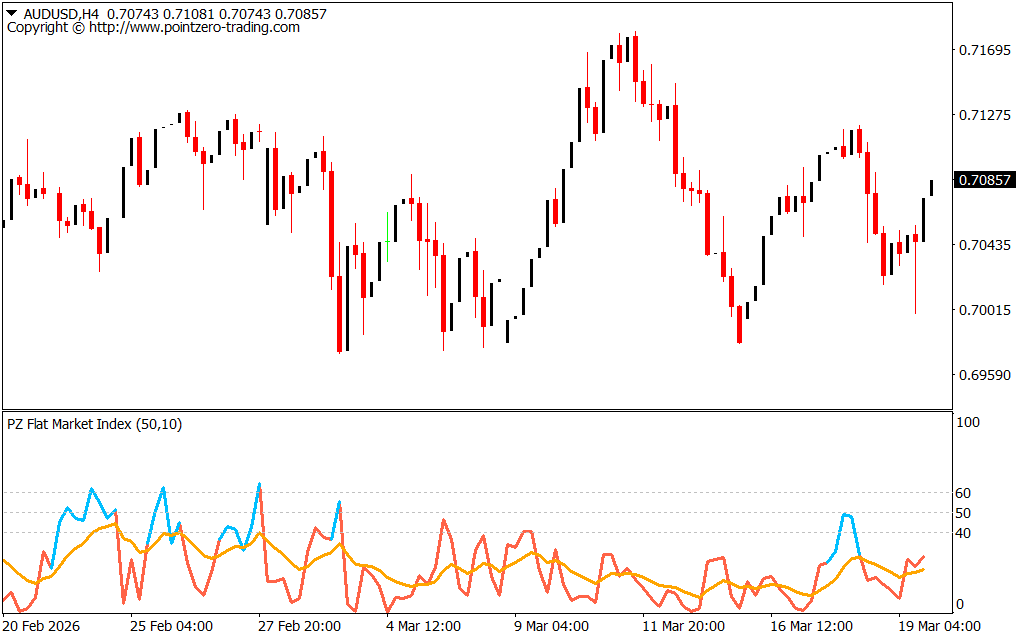
The GBP/USD H4 chart shows the Pz Flat Market Index Indicator in action. Traders can quickly spot trend reversals and momentum shifts by observing the overbought/oversold levels and the color-coded ATR line.
Conclusion
The Pz Flat Market Index Indicator for MT4 is a reliable momentum tool for identifying trend direction and potential reversals. Its clear overbought and oversold levels, along with ATR line crossovers, make it suitable for both new and advanced traders. The indicator is free to download and easy to use.
FAQ
Published:
Mar 19, 2026 16:47 PM
Category: