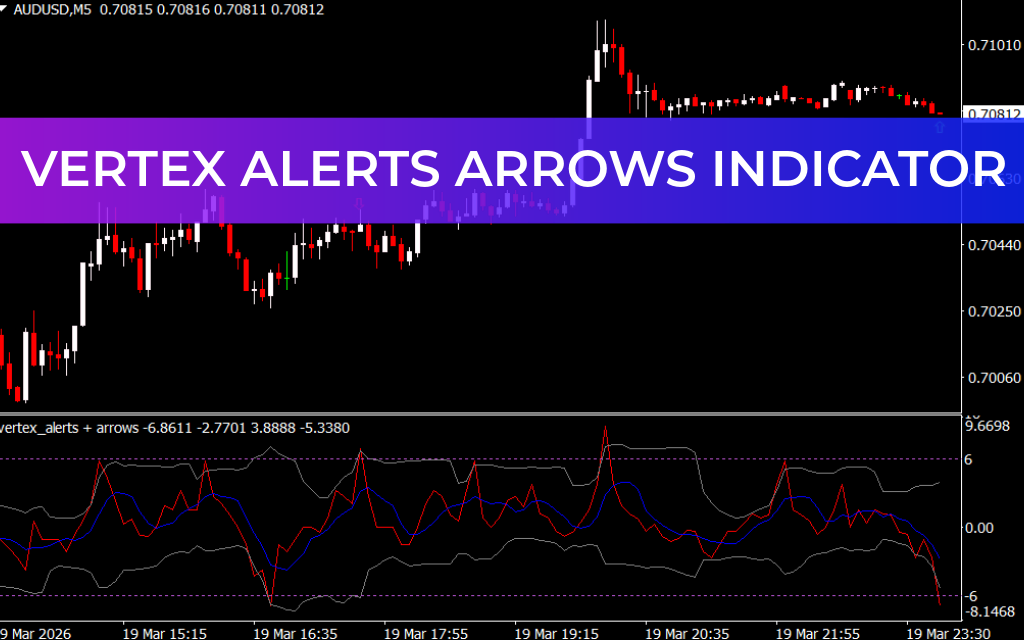
The Vertex Alerts Arrows indicator for MT4 is a multi-indicator oscillator designed to generate clear buy and sell signals for traders. The signals appear as arrows on the chart:
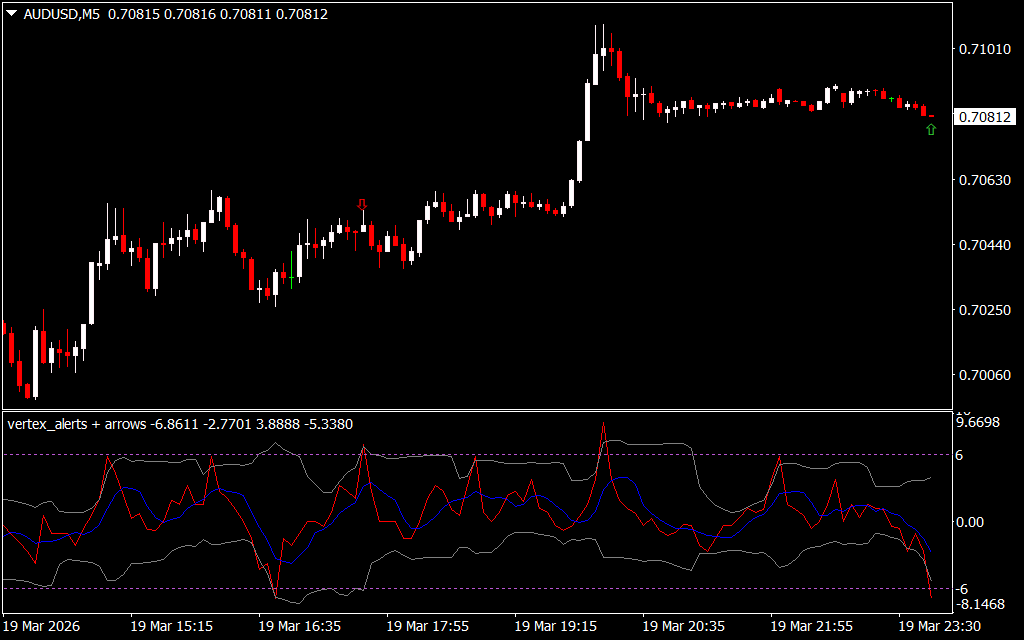
- Green upward arrows indicate a buy signal.
- Red downward arrows indicate a sell signal.
This indicator is ideal for novice traders who want a visual, easy-to-read signal system, though it works well for advanced traders when combined with other analyses.
How the Vertex Alerts Arrows Indicator Works
The indicator combines three popular technical tools:
- Bollinger Bands – to identify overbought and oversold zones.
- Moving Averages (MA) – to detect the market trend.
- Momentum – to measure the strength of price movements.
It calculates an adjusted momentum line (displayed as blue and red lines) that forms the basis for the Bollinger bands. This allows the indicator to generate highly responsive trading signals.
Trading Signals
Buy / Bullish Signal
A long trade is signaled when:
- Green upward arrow:
- The red momentum line is above the upper Bollinger band.
- The red line has a value below -6.
- Blue dot: Momentum has dropped below -10, indicating a strong buy condition.
Exit the trade at the next bearish signal.
Sell / Bearish Signal
A short trade is signaled when:
- Red downward arrow:
- The red momentum line is above the upper Bollinger band.
- The red line has a value above +6.
- Pink dot: Momentum rises above +10, confirming a strong sell signal.
Exit the trade at the next bullish signal.
Important Notes
- Arrow + dot signals are stronger than single arrow signals.
- Some signals may repaint, so use additional technical and fundamental analysis before taking trades.
- Always practice risk management, including stop-loss placement and position sizing.
Conclusion
The Vertex Alerts Arrows Indicator for MT4 is an excellent tool for traders seeking visual buy and sell signals. By combining Bollinger Bands, Moving Averages, and Momentum, it provides a clear method for spotting trade opportunities. However, for consistent profitability, it should be used alongside other analyses and proper risk management techniques.
FAQ
2 Downloads
Published:
Mar 19, 2026 18:51 PM
Category: