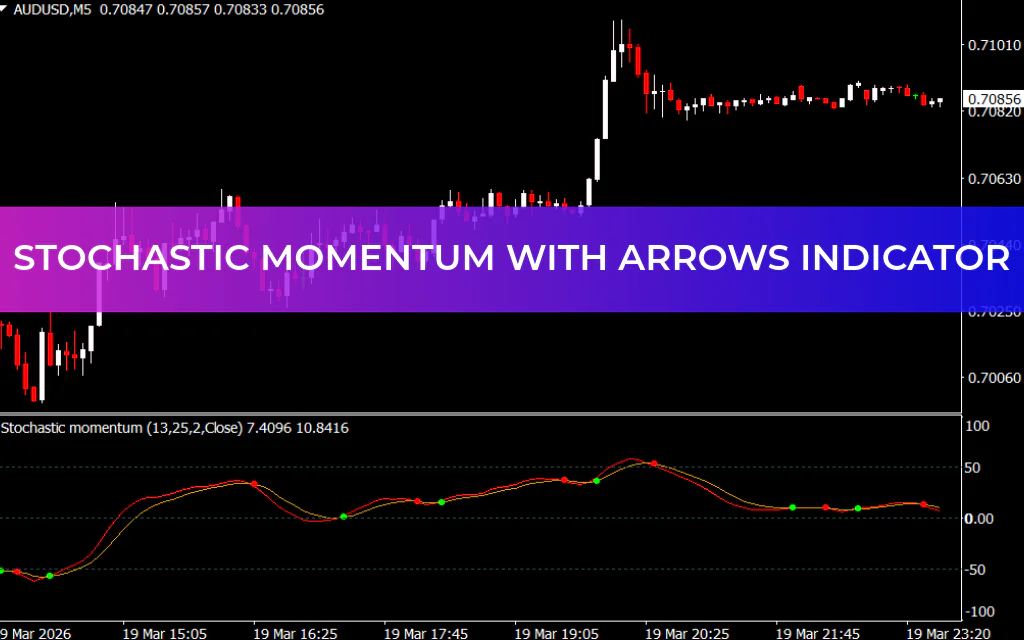
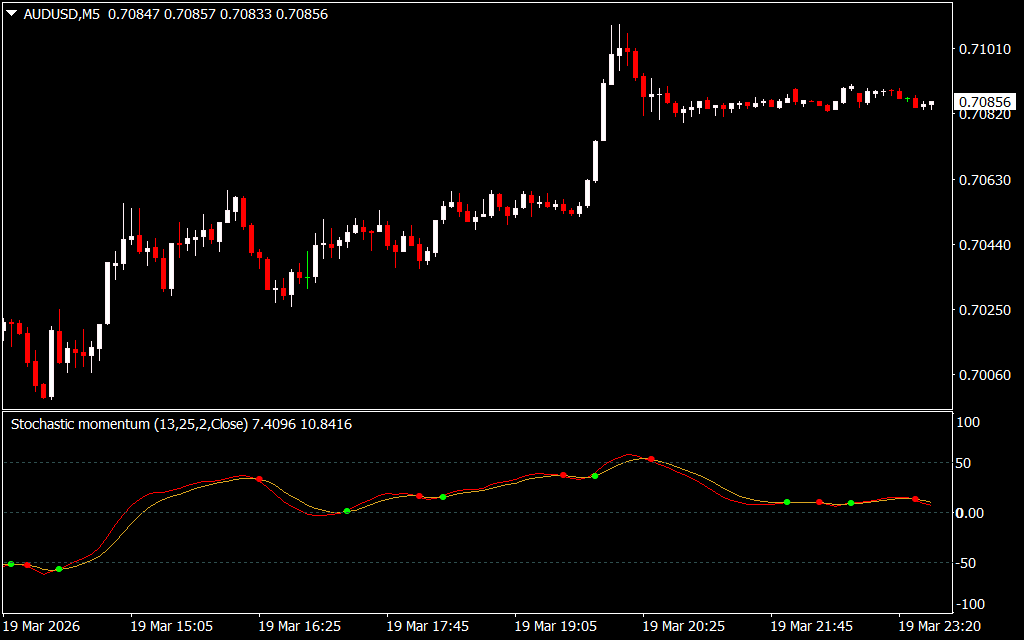
The Stochastic Momentum with Arrows indicator for MetaTrader is a custom trading tool designed to analyze overbought and oversold market conditions. Its algorithms are more sensitive to price momentum than the standard Stochastic indicator, making it an excellent tool for Scalping, intraday, and swing trading.
Is Stochastic a Momentum Indicator?
Yes, the stochastic indicator is widely recognized as a momentum tool because it reacts quickly to changes in the price of an asset, helping traders identify Trend Strength and potential reversals.
How to Read the Stochastic Momentum with Arrows Indicator
The indicator oscillates between +50 and -50 zones:
- +50 Zone: Indicates a bullish momentum bias.
- -50 Zone: Indicates a bearish momentum bias.
Additionally, the indicator includes signal dots for easier trade identification:
- Lime Dots: Suggest a potential bullish reversal – consider a BUY setup.
- Red Dots: Suggest a potential bearish reversal – consider a SELL setup.
These visual cues simplify trend analysis, making it accessible for both novice and experienced traders.
Trading Signals
BUY Signal:
- Wait for a Lime signal dot to appear below the -50 zone.
- Confirm with Price Action (e.g., bullish engulfing, pin bar).
- Open a long position.
SELL Signal:
- Wait for a Red signal dot to appear above the +50 zone.
- Confirm with price action (e.g., bearish engulfing).
- Open a short position.
Take Profit & Stop Loss:
- Use a 1:2 risk-to-reward ratio or your preferred trading plan.
- Optionally, trail profits and exit at the opposite indicator signal.
Key Advantages
- Highly Responsive: Faster and more precise than the standard stochastic oscillator.
- Visual Signals: Lime and red dots clearly indicate potential entries and exits.
- Versatile: Works for scalping, intraday, and swing trading.
- Free to Download: Easily available for MT4 users.
Conclusion
The Stochastic Momentum with Arrows indicator is a dynamic MT4 tool for identifying trend reversals and high-probability trading setups. Its enhanced momentum sensitivity and visual signal dots make technical analysis simpler and more effective.
FAQ
1 Download
Published:
Mar 19, 2026 18:45 PM
Category: