At some point in every forex trader’s journey, simply knowing the market direction is not enough. Traders also want to understand the strength behind price movement — how active the market is and how much price is likely to move.
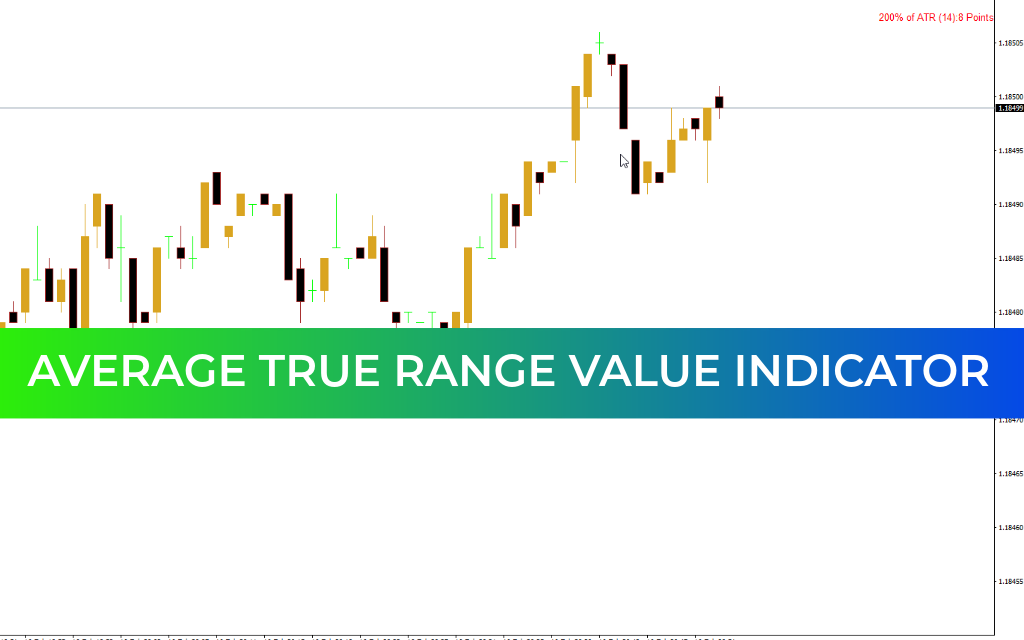
This is where the Average True Range (ATR) Value Indicator becomes extremely useful.
It measures market volatility, helping traders identify active trading conditions, set smarter stop losses, and plan realistic profit targets.
What Is the ATR Value Indicator?
The Average True Range (ATR) measures the average size of price movements over a selected period.
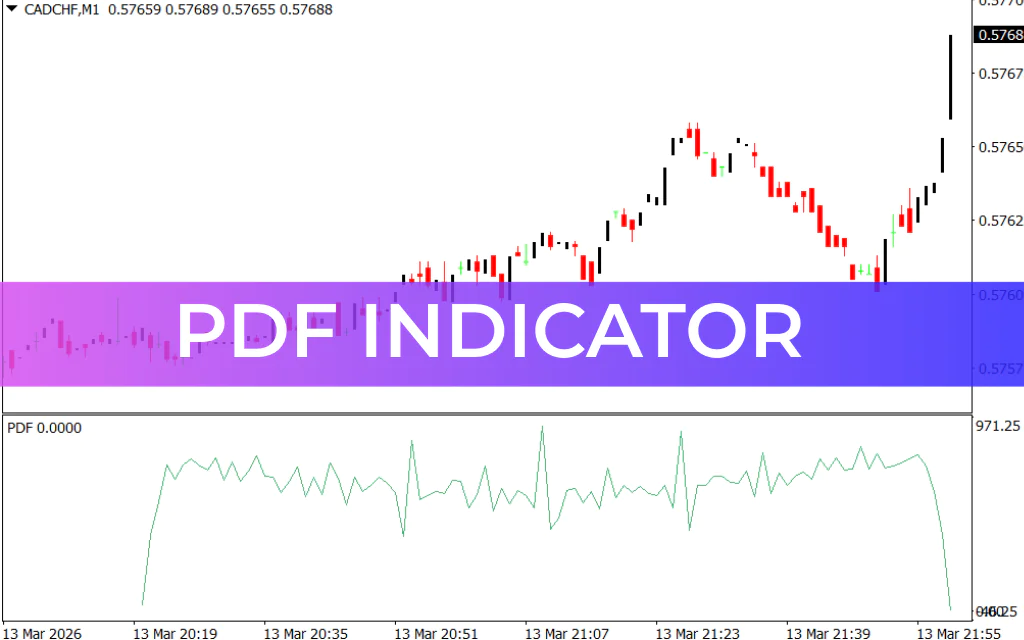
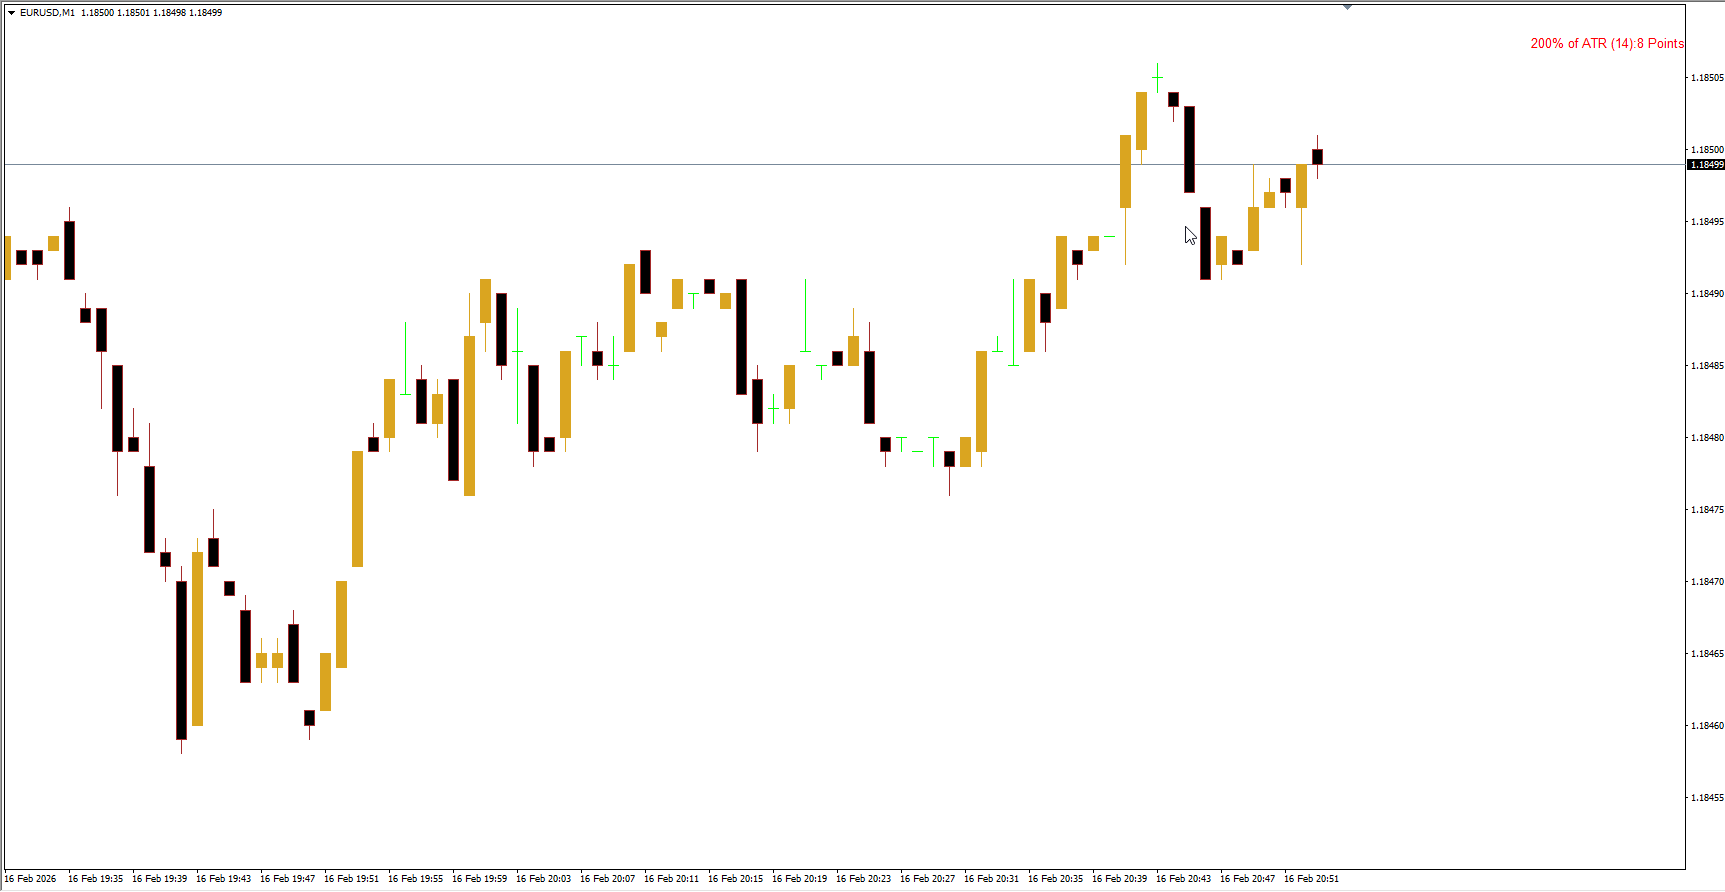
On MT4, it appears as a line in a separate indicator window:
Higher ATR value → Higher volatility
Lower ATR value → Lower volatility
This makes it easy to see whether the market is active or quiet.
⚠️ Important:
ATR does not show trend direction. It only measures movement size — not whether price is going up or down.
Why Traders Use ATR
Many traders mistakenly try to trade trends using ATR, but that’s not its purpose.
Instead, ATR helps traders:
✅ Identify active vs inactive markets
✅ Avoid low-volatility “dead” trading periods
✅ Set logical stop losses
✅ Estimate realistic profit targets
✅ Time breakout trades
It’s a risk management and volatility tool, not a Trend Indicator.
How the ATR Is Calculated
ATR measures the True Range of price movement, then averages it over time.
True Range is the greatest of:
Current High − Previous Low
Current Low − Previous Close
Current High − Current Low
The largest value becomes the True Range for that period.
ATR then averages these values over a selected number of candles.
Default MT4 Setting
Period: 14 candles
This produces a smooth line showing average volatility.
👉 ATR ignores direction — only movement size matters.
How to Trade Using the ATR Indicator
Here are the most practical ATR trading strategies.
1. Volatility Breakout Strategy
Markets move between quiet and active phases.
When ATR reaches extremely low levels, it often signals volatility expansion is coming.
Steps:
Check ATR on higher timeframe (like weekly)
Wait for very low volatility period
Mark Support And Resistance levels
Trade breakout when price escapes range
Low volatility often leads to powerful moves.
2. ATR Stop Loss Strategy
ATR helps place stop losses based on real market movement instead of random distances.
Steps:
Check current ATR value
Multiply by 1.5, 2, or 3
Add or subtract from entry price
This gives price enough room to move naturally.
You can also trail stop loss using ATR during strong trends.
3. ATR Take Profit Strategy
ATR estimates how far price typically moves.
Example:
Daily ATR = 140 pips
Average daily movement ≈ 140 pips
So profit targets can be set near this range.
Best used with:
Support and resistance
Swing highs and lows
Trend analysis
Common Trading Mistake to Avoid
Many traders try to use ATR to identify trend direction.
This is incorrect.
Markets can trend strongly while ATR falls — or move sideways while ATR rises.
Always combine ATR with trend indicators.
Who Should Use the ATR Indicator?
ATR is suitable for:
✔ Beginner traders learning risk management
✔ Swing traders setting realistic targets
✔ Breakout traders
✔ Scalpers measuring volatility
✔ Professional traders managing position size
Because it does not predict direction, ATR fits any trading style.
Advantages of the ATR Value Indicator
✔ Measures real market activity
✔ Improves stop loss placement
✔ Helps time entries
✔ Works on any timeframe
✔ Supports risk management
✔ Simple to interpret
Some custom ATR value indicators also save chart space and improve visual clarity compared to the default MT4 version.
Bottom Line
The Average True Range Value Indicator is one of the most practical tools in forex trading.
It helps traders:
Measure market volatility
Avoid inactive conditions
Set smarter stop losses
Plan realistic profit targets
Trade breakouts more effectively
If you want better risk control and smarter trade planning, ATR is an essential MT4 indicator.
FAQ
2 Downloads
Last Update:
Feb 16, 2026 15:44 PM
Published:
Feb 16, 2026 15:01 PM
Category: