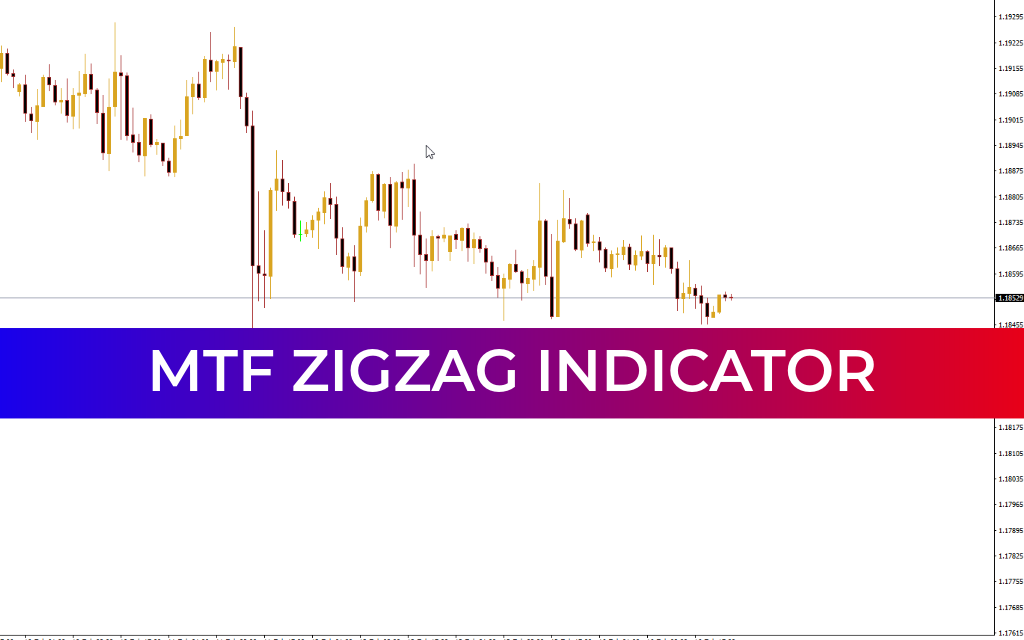
The Mtf ZigZag indicator analyzes price behavior and marks sell-off and rally waves with lines that connect important price extremes. The Forex market often experiences chaotic fluctuations due to high trading activity and automated trading systems. These impulsive movements, known as market noise, can obscure meaningful trends and price zones.
The main purpose of the Mtf ZigZag indicator is to separate true price movements from false ones, helping traders identify key levels and turning points. Visually, the indicator appears as a continuous line connecting the most significant highs and lows on the chart.
It uses parameters such as ExtDeviation, ExtDepth, and ExtBackStep to plot its levels. These settings allow traders to adjust the sensitivity of the indicator to price changes and better capture relevant market extremes.
How to Use the Mtf ZigZag Indicator
Although the indicator does not provide direct entry points, its clear visual signals can support trading decisions in several ways.
Identifying Support And Resistance Levels
Support and resistance levels are critical concepts in technical analysis. They represent areas where price has historically reversed or paused, reflecting market sentiment. The Mtf ZigZag indicator highlights the highest and lowest points of price movements, which can serve as potential support and resistance zones.
The reliability of these levels increases if the price reacts to them frequently, and signals from higher timeframes carry more weight than those from lower ones. For convenience, traders can also use the Support&Resistance indicator to complement this analysis.
Plotting Trendlines
Trendlines are another fundamental tool in technical analysis, used to visualize the direction of a trend. By connecting the highs and lows marked by the Mtf ZigZag indicator, traders can manually draw bullish or bearish trendlines.
For example, a bullish trendline can be drawn through higher lows, while a bearish trendline is drawn through lower highs. This approach allows traders to monitor trend progression and potential breakout points. The AutoTrendLines indicator can automate this process for greater efficiency.
Applying Fibonacci Levels
The Mtf ZigZag indicator can also assist in applying Fibonacci retracement levels. By identifying sell-off and rally waves, traders can use these extremes to plot Fibonacci levels accurately. This helps in predicting potential reversal points, such as the 50% retracement, where price often resumes the original trend.
For traders new to Fibonacci analysis, the free Fiboretracement indicator provides additional guidance and tools for learning.
Multiple Timeframe Analysis
The indicator can be applied across multiple timeframes simultaneously. This multi-timeframe approach enhances its effectiveness, as signals confirmed on several timeframes are generally more reliable and provide a clearer picture of the overall Market Structure.
Conclusion
The Mtf ZigZag indicator is a powerful tool for analyzing Forex market behavior. By filtering out noise and highlighting significant price movements, it helps traders identify support and resistance levels, draw trendlines, and apply Fibonacci levels more accurately. When used in combination with other technical analysis tools, it can improve decision-making and enhance trading strategies.
FAQ
Last Update:
Feb 16, 2026 16:34 PM
Published:
Feb 16, 2026 16:31 PM
Category: