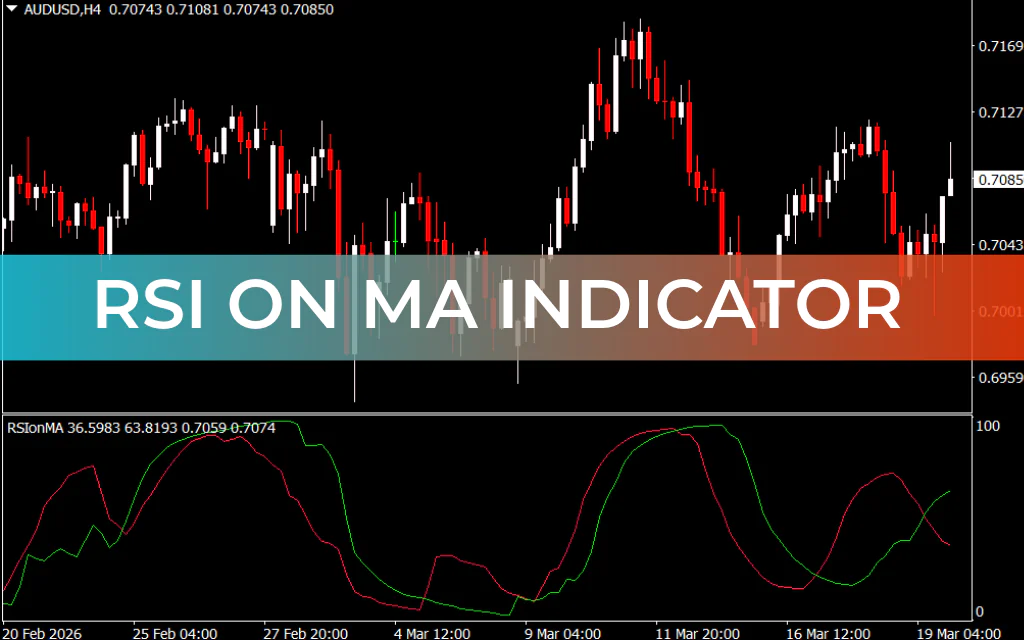
The RSI on MA Crossover Indicator for MT4 is a powerful trend-following and Momentum Indicator that combines Moving Average crossovers with the Relative Strength Index (RSI). Unlike a standard MA crossover, this tool not only identifies trends but also captures the momentum of the market, making it ideal for intraday and swing trading.
Key Features
- Dual Lines:
- Crimson Line → Faster-moving RSI
- Lime Green Line → Slower-moving RSI
- Oscillator Range: The lines oscillate between 0 and 100, similar to traditional RSI.
- Multi-Market Application: Works on forex, commodities, metals, and stocks.
- Timeframe Flexibility: Suitable for any timeframe, supporting both short-term and long-term trend analysis.
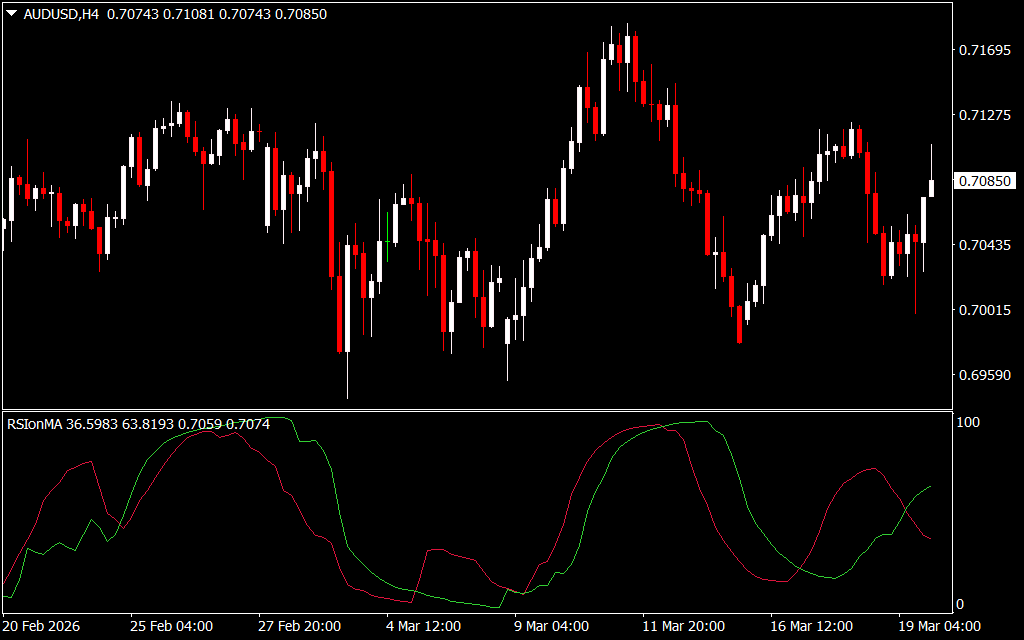
How to Trade with RSI on MA Crossover
- Buy Signal:
- The crimson line crosses above the lime green line, signaling rising momentum.
- Place a stop loss below the entry candle or swing low.
- Sell Signal:
- The crimson line crosses below the lime green line, indicating declining momentum.
- Place a stop loss above the entry candle or swing high.
- Trade Exit:
- Close the trade when the lines cross in the opposite direction or when the price hits a key support/resistance level.
Real Market Example
On the EUR/USD 1H chart, the crimson line crossed below the lime green line, signaling a bearish move. The market moved over 100 pips following the sell signal. Similarly, a bullish crossover resulted in over 70 pips movement, confirming the indicator’s effectiveness in capturing trends and momentum.
The key advantage is that each crossover invalidates the previous signal, helping traders avoid confusion and maintain a clear trading direction.
Conclusion
The RSI on MA Crossover Indicator is an effective tool to identify both market trend and momentum. While it can function as a standalone indicator, it performs best when combined with other trend-following tools or technical analysis strategies for enhanced signal accuracy.
FAQ
1 Download
Published:
Mar 19, 2026 16:50 PM
Category: