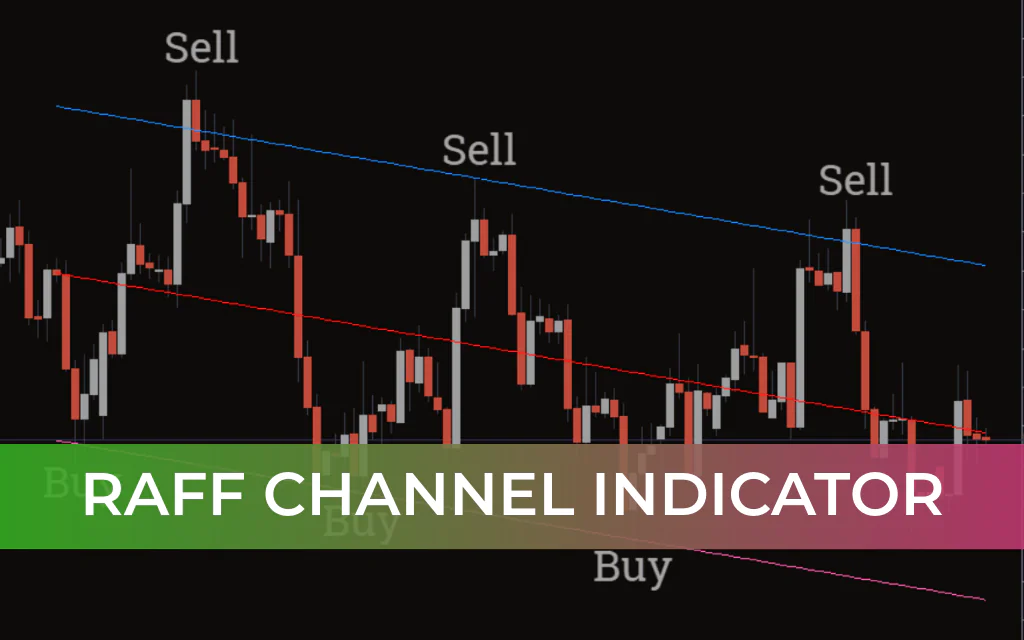
The Raff Channel Indicator for MT4 is a regression-based trend channel tool that automatically plots a price channel using a first-order linear regression midline. The upper and lower channel lines act as dynamic Support And Resistance, helping traders identify high-probability entry and exit points.
Price interaction with the channel boundaries often signals potential reversals, while a sustained breakout beyond the channel can indicate a major trend change.
This indicator is suitable for both beginner and advanced traders and works across all intraday and higher timeframes, including daily, weekly, and monthly charts. It is free to download and easy to install.
How the Raff Channel Indicator Works
The indicator plots three main components:
Upper Channel Line (Blue) → Resistance
Midline (Red) → Linear regression trend direction
Lower Channel Line (Pink) → Support
The Red midline determines overall trend direction:
Ascending midline → Bullish trend
Descending midline → Bearish trend
The outer channel lines define statistically significant price extremes.
Raff Channel Indicator for MT4 – Trading Signals
Buy Setup (Bullish Market)
The Red regression line is sloping upward (bullish trend).
Price touches or approaches the lower channel boundary (Pink line).
Look for bullish confirmation (rejection candle or reversal pattern).
Enter a BUY trade.
Stop Loss:
Below the previous swing low.
Take Profit:
Near the upper channel boundary (Blue line).
Channel extremes provide favorable risk-reward opportunities in regression-based strategies.
Sell Setup (Bearish Market)
The Red regression line slopes downward (bearish trend).
Price touches the upper channel boundary (Blue line).
Confirm with bearish Price Action.
Enter a SELL trade.
Stop Loss:
Above the previous swing high.
Take Profit:
Near the lower channel boundary (Pink line).
Breakout Consideration
If price breaks and sustains movement outside the channel:
It may indicate a Trend Reversal.
Wait for confirmation before entering breakout trades.
Combine with volume or momentum indicators for higher accuracy.
Multi-Timeframe (MTF) Strategy
The Raff Channel Indicator performs exceptionally well in a multi-timeframe approach:
Identify the primary trend on a higher timeframe.
Use a lower timeframe to refine entry points at channel extremes.
Trade in the direction of the higher timeframe regression slope.
General rule:
Higher timeframe trend direction should guide lower timeframe entries.
Multi-Indicator Strategy
Traders can use multiple instances of the Raff Channel:
One with a higher number of bars (long-term trend).
One with default or shorter settings (short-term structure).
Trade in the direction of the broader regression channel while using the shorter channel for precision entries.
Advantages of the Raff Channel Indicator
Automatically plots regression-based channels
Clearly identifies trend direction
Defines dynamic support and resistance levels
Offers high risk-reward setups
Works on all timeframes
Suitable for standalone or confluence trading
Important Trading Tip
Although effective as a standalone indicator, combining the Raff Channel with:
Momentum oscillators
Volume indicators
Support and resistance analysis
Price action confirmation
can significantly enhance trade accuracy.
Conclusion
The Raff Channel Indicator for MT4 is a powerful regression-based trend channel tool that identifies structured price extremes and dynamic support/resistance levels.
Because it focuses on channel boundaries, it produces fewer but higher-quality trade setups. When combined with multi-timeframe analysis and additional confirmation tools, it becomes a highly effective strategy for trend-based forex trading.
The indicator is free, easy to install, and suitable for traders of all experience levels.
FAQ
6 Downloads
Published:
Feb 20, 2026 06:53 AM
Category: