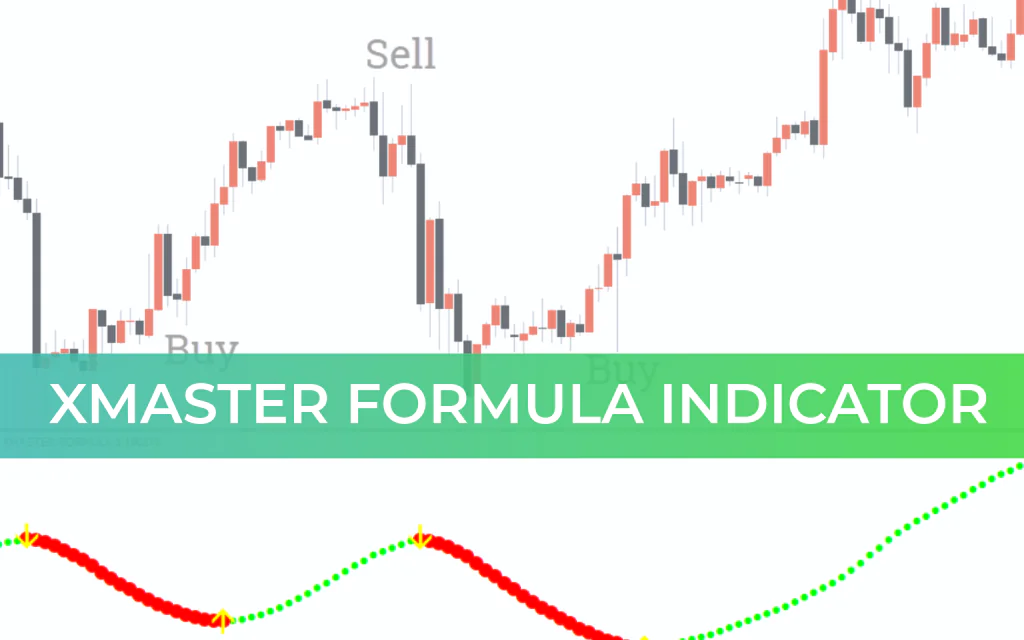
The Xmaster Formula Indicator for MT4 is a powerful trend-following tool that combines Moving Averages, RSI, and MACD into a single, easy-to-read interface. Despite its complex engine, the output is simple: clear BUY and SELL arrows and color-coded trend indicators (BULLISH in LIME, BEARISH in RED).
This indicator is ideal for both new and experienced forex traders using any trend-following strategy. It works across intraday timeframes (H1, H4) as well as daily, weekly, and monthly charts, making it versatile for multiple trading styles.
Key Features
Clear BUY and SELL arrows for quick trading decisions
Trend indication via color-coded dots: LIME for bullish trends, RED for bearish trends
Combines multiple indicators into one clean interface
Suitable for trend followers, scalpers, and intraday traders
Free to download and easy to install
How to Use the Xmaster Formula Indicator
Buy Trade:
Enter when a YELLOW upward arrow appears and the dots are LIME.
Place stop-loss below the previous swing low.
Take profit at the next opposite signal arrow or using support/resistance levels.
Sell Trade:
Enter when a YELLOW downward arrow appears and the dots are RED.
Place stop-loss above the previous swing high.
Take profit at the next opposite signal arrow or using support/resistance levels.
Multi-Timeframe Strategy (MTF):
Identify the trend on a higher timeframe (H4 or Daily).
Use a lower timeframe (H1) to find precise entries.
Enhanced Accuracy:
Combine arrow and dot signals with Support And Resistance levels or trendlines.
Wait for both signals to align for higher probability trades.
Pros and Cons
✅ Pros
Clear BUY and SELL arrows simplify decision-making
Combines multiple indicators into one easy-to-read tool
Suitable for beginners and experienced traders
Effective across multiple timeframes
❌ Cons
May lag during sharp reversals
Signals are less effective in sideways markets
Works best when combined with basic market context
Conclusion
The Xmaster Formula Indicator is an excellent trend-following tool for traders seeking clarity and simplicity on their charts. Its arrow signals and trend dots reduce clutter while helping traders make informed decisions. Best results are achieved when combined with support/resistance levels, trendlines, or higher timeframe analysis. The indicator is free to download, easy to install, and performs best on the most actively traded currency pairs.
Frequently Asked Questions (FAQ)
Is Xmaster Formula Indicator suitable for beginners?
Yes, the clear arrows and color-coded trend dots make it easy to use.
Are the signals repainting?
No, all signals are based on confirmed market data.
Which timeframe works best?
H1 and higher timeframes are the most reliable.
Can it be used alone?
Yes, but performance improves when paired with support and resistance levels.
Is it suitable for Scalping?
It can be used for scalping, but it is optimized for trend-following setups.
FAQ
8 Downloads
Published:
Feb 20, 2026 11:02 AM
Category: