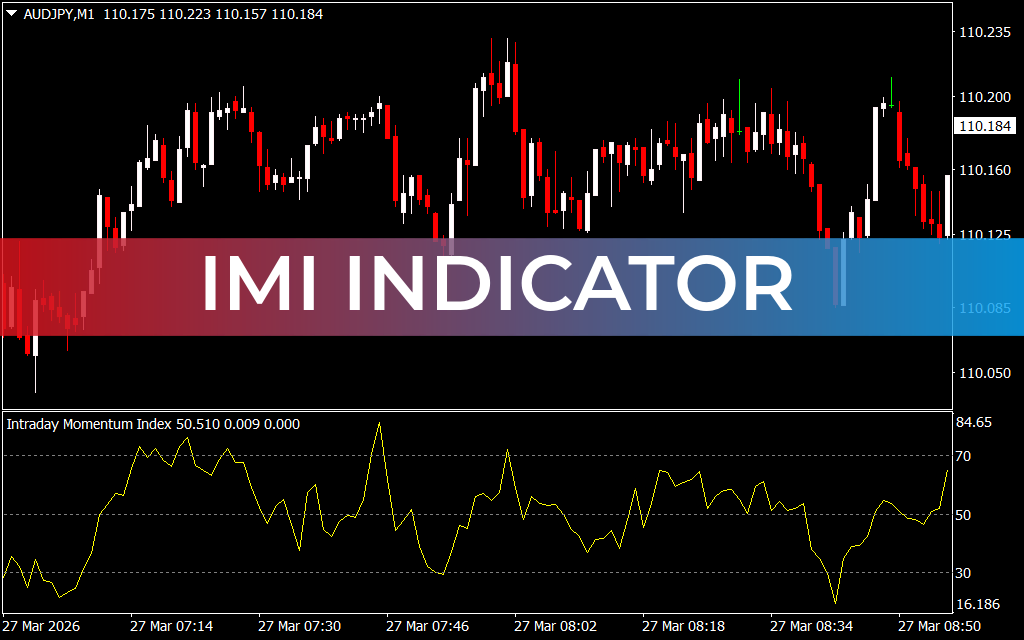
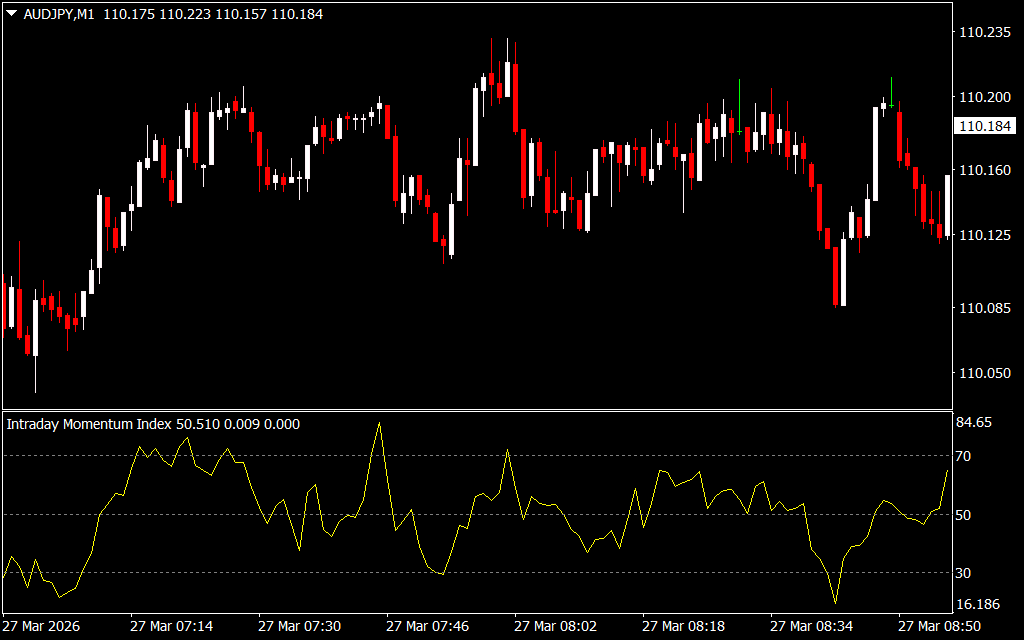
The IMI (Intraday Momentum Index) Indicator for MetaTrader 4 is a short-term momentum tool designed to help traders spot overbought and oversold levels in trending markets. By combining the Relative Strength Index (RSI) with candlestick open and close prices, the IMI provides actionable signals for intraday and Scalping strategies.
What Is the IMI Indicator?
- Functions as a momentum oscillator
- Swings between overbought (70) and oversold (30) zones
- Indicates potential price reversals at extreme levels
- Suitable for novice and experienced traders
- Ideal for intraday, scalping, and day trading
How to Trade With the IMI Indicator
BUY Signal
- Confirm the market is in an uptrend
- Wait for the IMI line to reach the oversold zone (30)
- Enter a long position after observing a bullish reversal candlestick pattern (e.g., bullish engulfing)
SELL Signal
- Confirm the market is in a downtrend
- Wait for the IMI line to reach the overbought zone (70)
- Enter a short position after observing a bearish reversal candlestick pattern (e.g., bearish engulfing)
Tip: Always combine the IMI with Price Action or other indicators to reduce false signals.
Key Benefits
- Detects trend reversals at critical overbought/oversold levels
- Supports multiple trading timeframes
- Works for scalping, intraday, and day trading
- Suitable for traders of all experience levels
- Free and easy to install on MT4
Conclusion
The IMI Indicator for MT4 is a reliable tool to identify short-term trend reversals. While it’s not immune to false signals, its integration with price action and trending markets makes it a valuable addition to any forex trading strategy. The indicator is free to download and easy to use.
FAQ
1 Download
Published:
Mar 28, 2026 19:33 PM
Category: