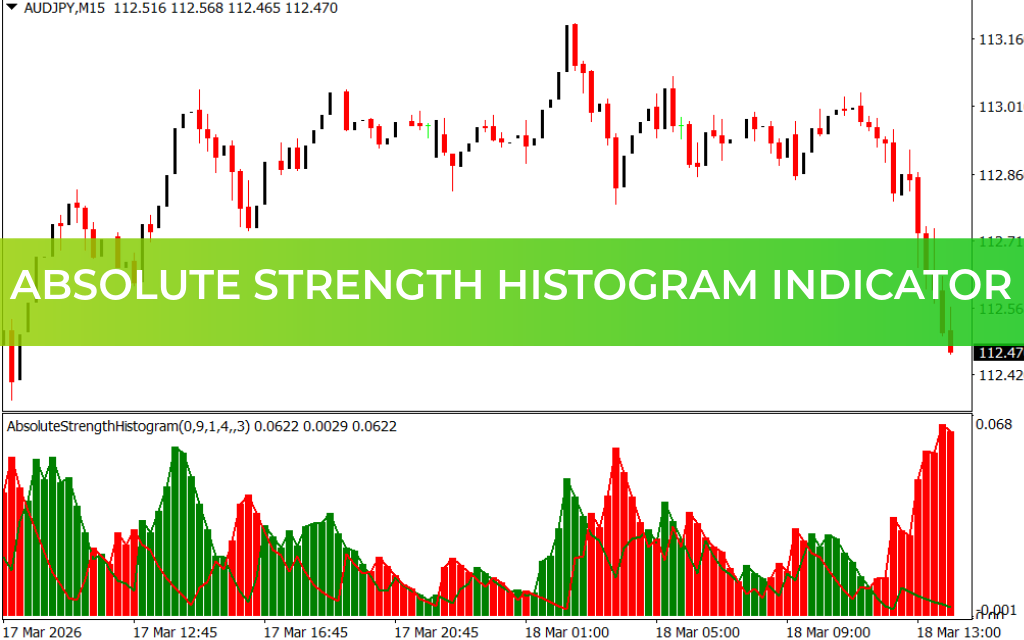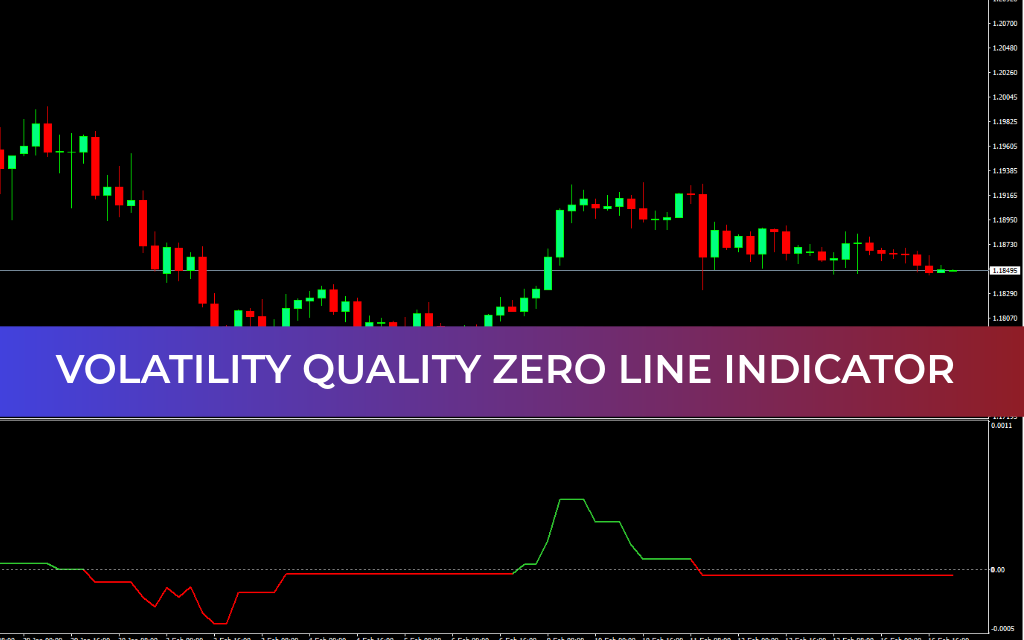
The VQ Zero Line uses Open, High, Low, Close (OHLC) values and a Weighted Moving Average to calculate its readings.
Green line: Indicates an uptrend in the market.
Red line: Indicates a downtrend in the market.
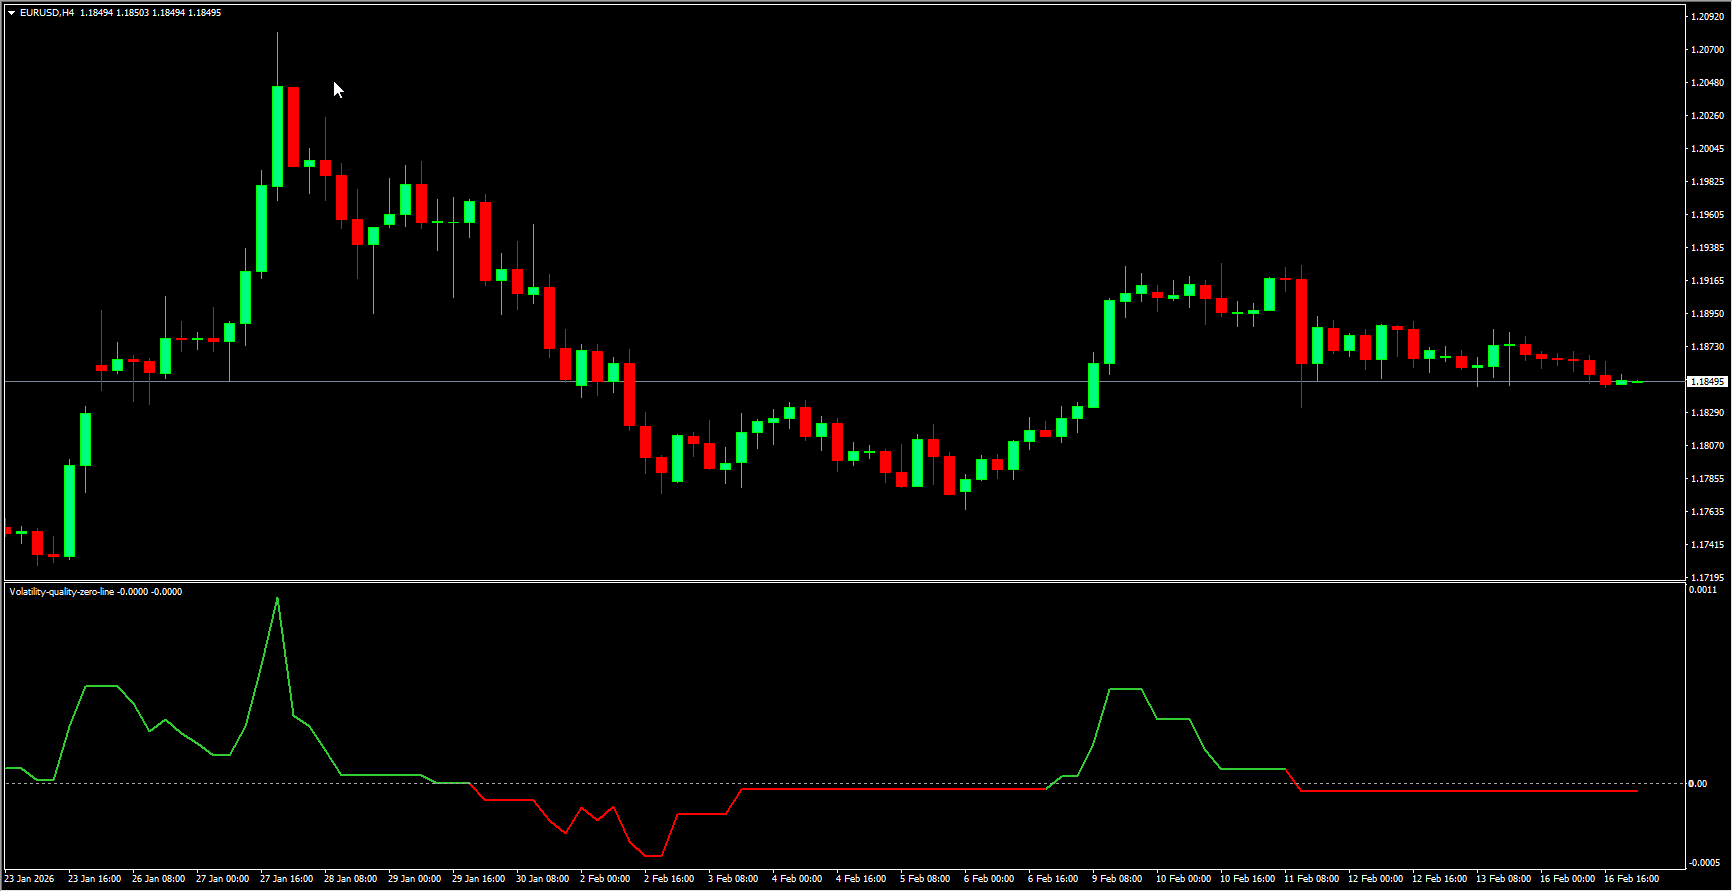
Distance from zero line: The farther the line is from the zero level, the higher the market volatility.
This indicator is a refined version of the original Volatility Quality indicator developed by Thomas Stridsman. It is less sensitive, produces fewer signals, and is more resistant to false breakouts, reducing the chance of entering trades prematurely.
How to Trade with the VQ Zero Line Indicator
Entry Signals
Go long (buy) when the line turns from red to green.
Go short (sell) when the line turns from green to red.
These signals generally coincide with the line crossing the zero level, indicating a potential Trend Reversal.
Trade Management
Take Profit
Exit trades when a new signal appears. For example, exit long positions when the line changes from green to red, and exit short positions when it changes from red to green.
Stop Loss
Place your stop loss at the most recent high or low before the signal occurs.
For a downtrend, the stop loss should be above the most recent high.
For an uptrend, the stop loss should be below the most recent low.
This method helps filter trades by avoiding entries when the previous highs or lows are too distant, reducing the risk of low-momentum trades.
Advantages of the VQ Zero Line Indicator
Combines trend direction and volatility analysis in one tool
Clear visual signals using green and red lines
Fewer false breakouts compared to the original Volatility Quality indicator
Easy to interpret for traders of all levels
Compatible with MT4 and MT5 trading platforms
Can be used for both short-term and long-term trading strategies
Limitations
The indicator may react slower to sudden price movements due to its smoothing method
Stop loss and take profit levels must be determined by the trader
Conclusion
The Volatility Quality Zero Line Indicator is an intuitive tool suitable for all Forex traders. It provides clear trend signals while giving insight into market volatility. By combining trend-following with volatility analysis, traders can identify high-probability trades and manage risk more effectively. Its simplicity and ease of use make it ideal for both beginners and experienced traders.
FAQ
3 Downloads
Published:
Feb 16, 2026 17:23 PM
Category: