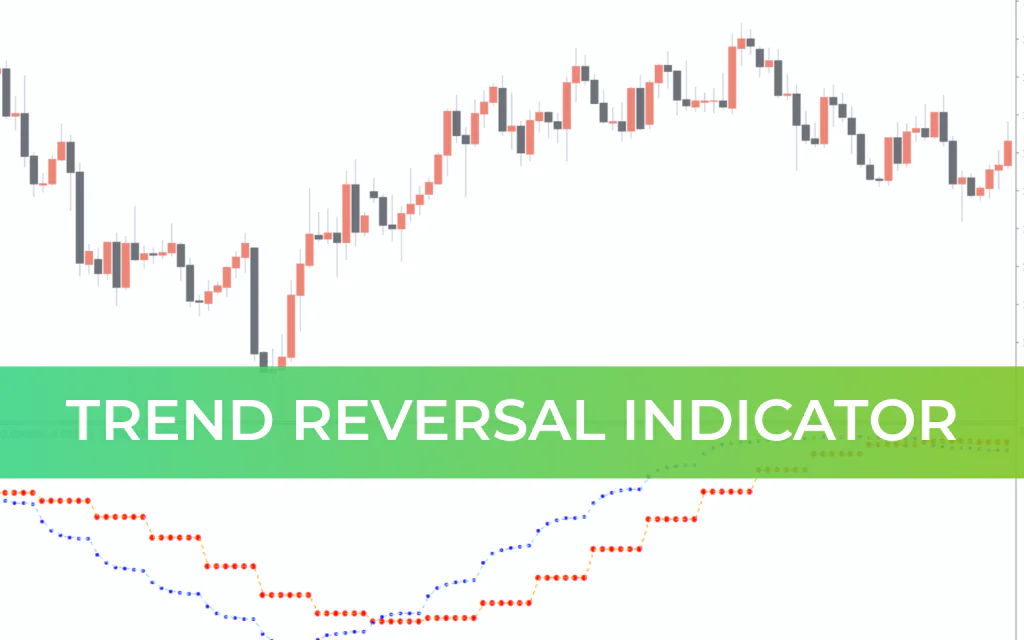
The Trend Reversal Indicator for MetaTrader 4 is a momentum oscillator built on two Exponential Moving Averages (EMAs). It appears in a separate window below the main price chart and generates BUY and SELL signals when the fast and slow EMAs cross each other.
This crossover mechanism makes it a reliable tool for identifying potential trend reversals and early shifts in market direction.
How the Trend Reversal Indicator Works
The indicator uses:
Fast EMA (blue dotted line)
Slow EMA (red line)
When these two lines intersect, a trading signal is generated.
Fast EMA crossing above Slow EMA → Bullish reversal signal
Fast EMA crossing below Slow EMA → Bearish reversal signal
Because the signals are based on EMA crossovers, they reflect momentum shifts rather than random price fluctuations.
Timeframe Compatibility
The indicator can be used on all timeframes:
M1 for Scalping
M5–M15 for intraday trading
H1–H4 for swing trading
Daily to Monthly for long-term analysis
While it works on lower timeframes, it performs more reliably on higher timeframes such as H4, where market noise is reduced. On very short timeframes, frequent crossovers during consolidation may produce multiple small losses.
Buy Signal Strategy
A BUY signal occurs when:
The Fast EMA (blue line) crosses above the Slow EMA (red line)
Enter at the opening of the next candle
Exit Options
Use a predefined risk-to-reward ratio (e.g., 1:2 or higher)
Exit when a SELL signal appears
Trail stop as the trend develops
Stop Loss
Place a few pips below the nearest support level or recent swing low
Sell Signal Strategy
A SELL signal occurs when:
The Slow EMA (red line) crosses above the Fast EMA (blue line)
Enter at the opening of the next candle
Exit Options
Use a fixed risk-to-reward target
Exit when a BUY signal appears
Stop Loss
Place a few pips above the recent swing high or resistance level
Example Overview (AUDCAD)
On an AUDCAD chart:
The red line crosses above the blue line around 0.93314 at 08:00 (June 1st)
The next candle open provides a short entry
Later, the blue line crosses above the red line at 18:15, signaling a bullish reversal
Price moves approximately 30 pips before the next bearish crossover
This demonstrates how the indicator identifies momentum shifts in real time.
Important Considerations
During sideways or consolidating markets, EMA crossovers may generate frequent signals. Therefore, it is highly recommended to combine this indicator with:
Support And Resistance analysis
Trend filters
Volume or momentum indicators
Higher timeframe confirmation
Adjusting EMA periods in the settings allows traders to customize sensitivity based on their strategy.
Final Verdict
The Trend Reversal Indicator for MT4 is a straightforward and effective EMA crossover tool designed to identify potential turning points in the market. Its simplicity makes it suitable for beginners, while its flexibility allows advanced traders to integrate it into complex systems.
For best performance, combine it with additional confirmation tools and sound risk management principles. When used correctly, it can become a valuable component of a trend-based trading strategy.
FAQ
3 Downloads
Published:
Feb 20, 2026 01:19 AM
Category: