The Market Facilitation Index (MFI) was developed by Bill Williams as part of his early trading system, described in his book Trading Chaos. He considered this indicator one of the most effective tools for measuring how the market reacts to changes in trading volume.
Although Williams emphasized that his approach differs from traditional technical analysis, many of his indicators are built on modified moving averages or oscillator concepts. The Market Facilitation Index, however, focuses specifically on the relationship between price movement and trading activity.
Market Facilitation Index Calculation
The indicator is based on a simple formula:
MFI = (High – Low) ÷ Volume
Where:
High = highest price of the current candle
Low = lowest price of the current candle
Volume = tick trading volume
This calculation shows how efficiently price is moving relative to trading volume.
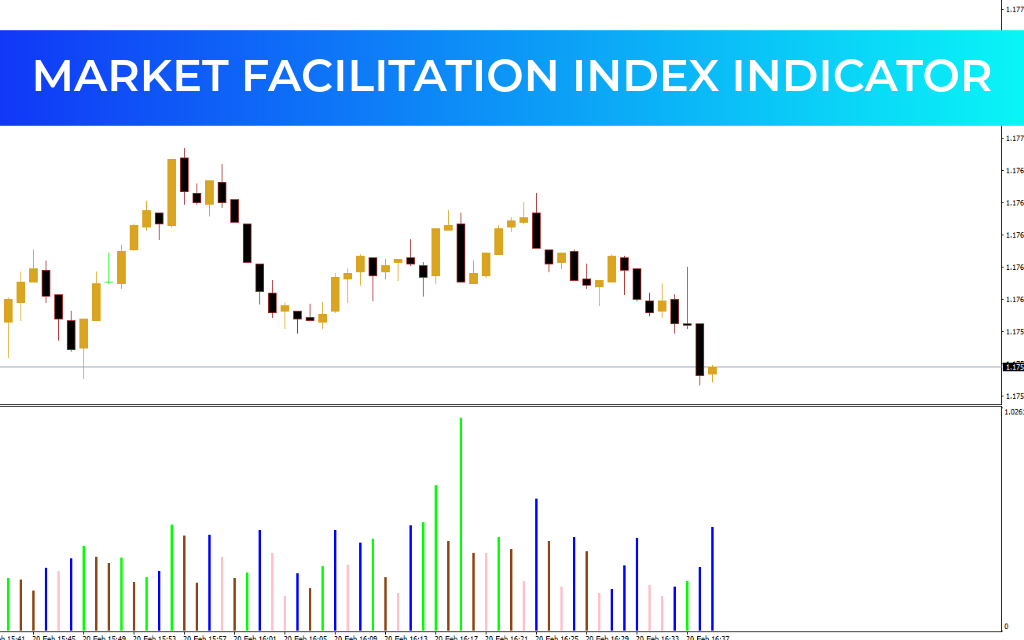
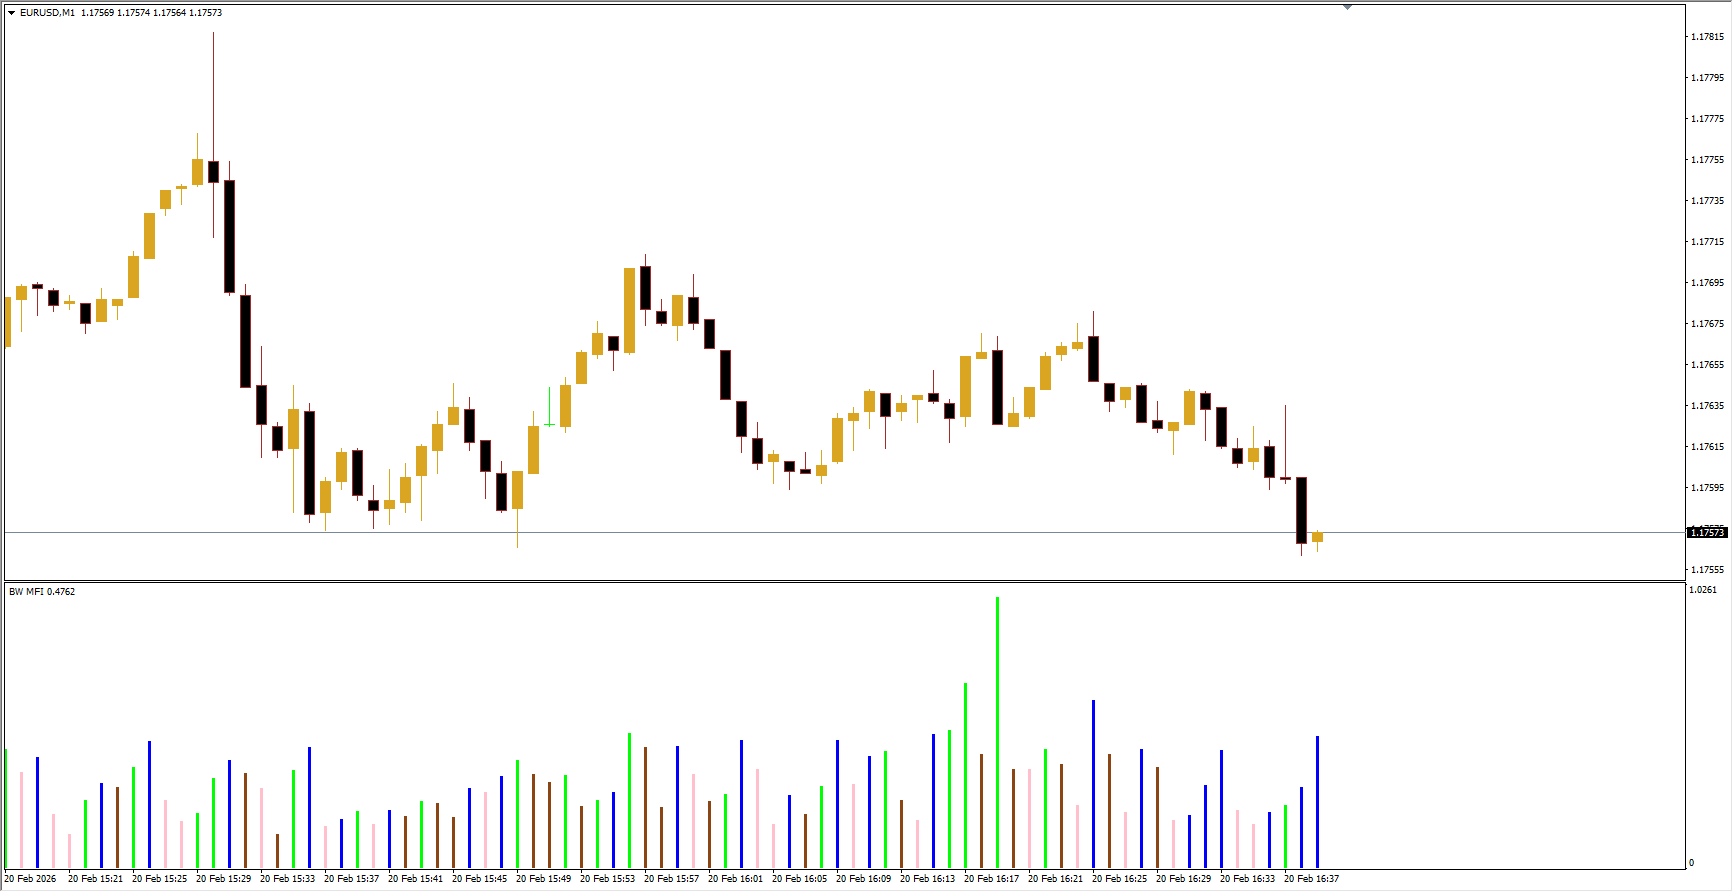
How the Market Facilitation Index Works
The MFI appears as a color-coded histogram. Each bar color reflects a specific market condition:
Green Bar — Strong Trend
Volume and price movement are both increasing.
Indicates strong market participation and trend continuation.
Not ideal for new entries, but confirms existing trades.
Brown Bar — Weakening Movement
Market activity and interest are declining.
Often signals slowing momentum or a potential sideways phase.
Not a reliable signal for reversing positions.
Blue Bar — Uncertain Market
Price moves despite low participation from both buyers and sellers.
Indicates weak conviction and possible sudden reversal or pause.
Pink Bar — Potential Reversal
Strong activity from both buyers and sellers.
Often appears before major trend reversals.
Considered the most important signal for trading opportunities.
Market Facilitation Index Trading Strategy
Buy Setup
A pink bar appears on the MFI.
Place a buy stop order a few pips above the latest swing high.
Set stop-loss below the recent swing low.
Take profit at 2–3 times the stop-loss distance, depending on nearby key levels.
Sell Setup
A pink bar appears on the MFI.
Place a sell stop order a few pips below the latest swing low.
Set stop-loss above the recent swing high.
Take profit at 2–3 times the stop-loss distance.
Conclusion
The Market Facilitation Index is a practical tool for evaluating Trend Strength and potential reversals by measuring the relationship between price movement and trading volume. Its color-coded histogram makes market conditions easy to interpret, with the pink bar being especially important for spotting possible turning points. While effective on its own, the indicator delivers the best results when combined with Price Action analysis and other technical tools.
FAQ
Published:
Feb 20, 2026 11:25 AM
Category: