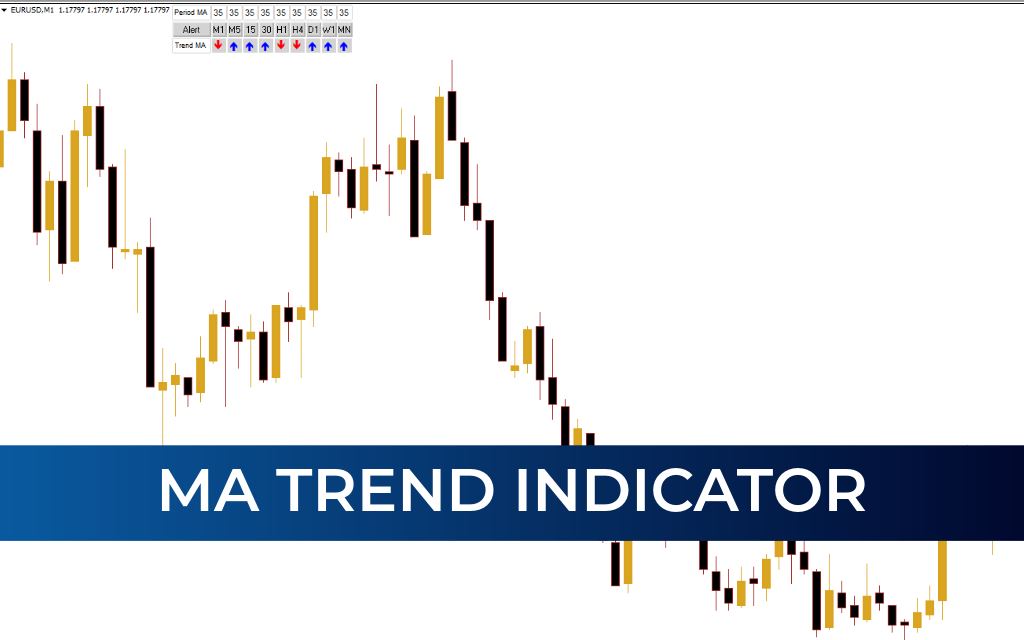
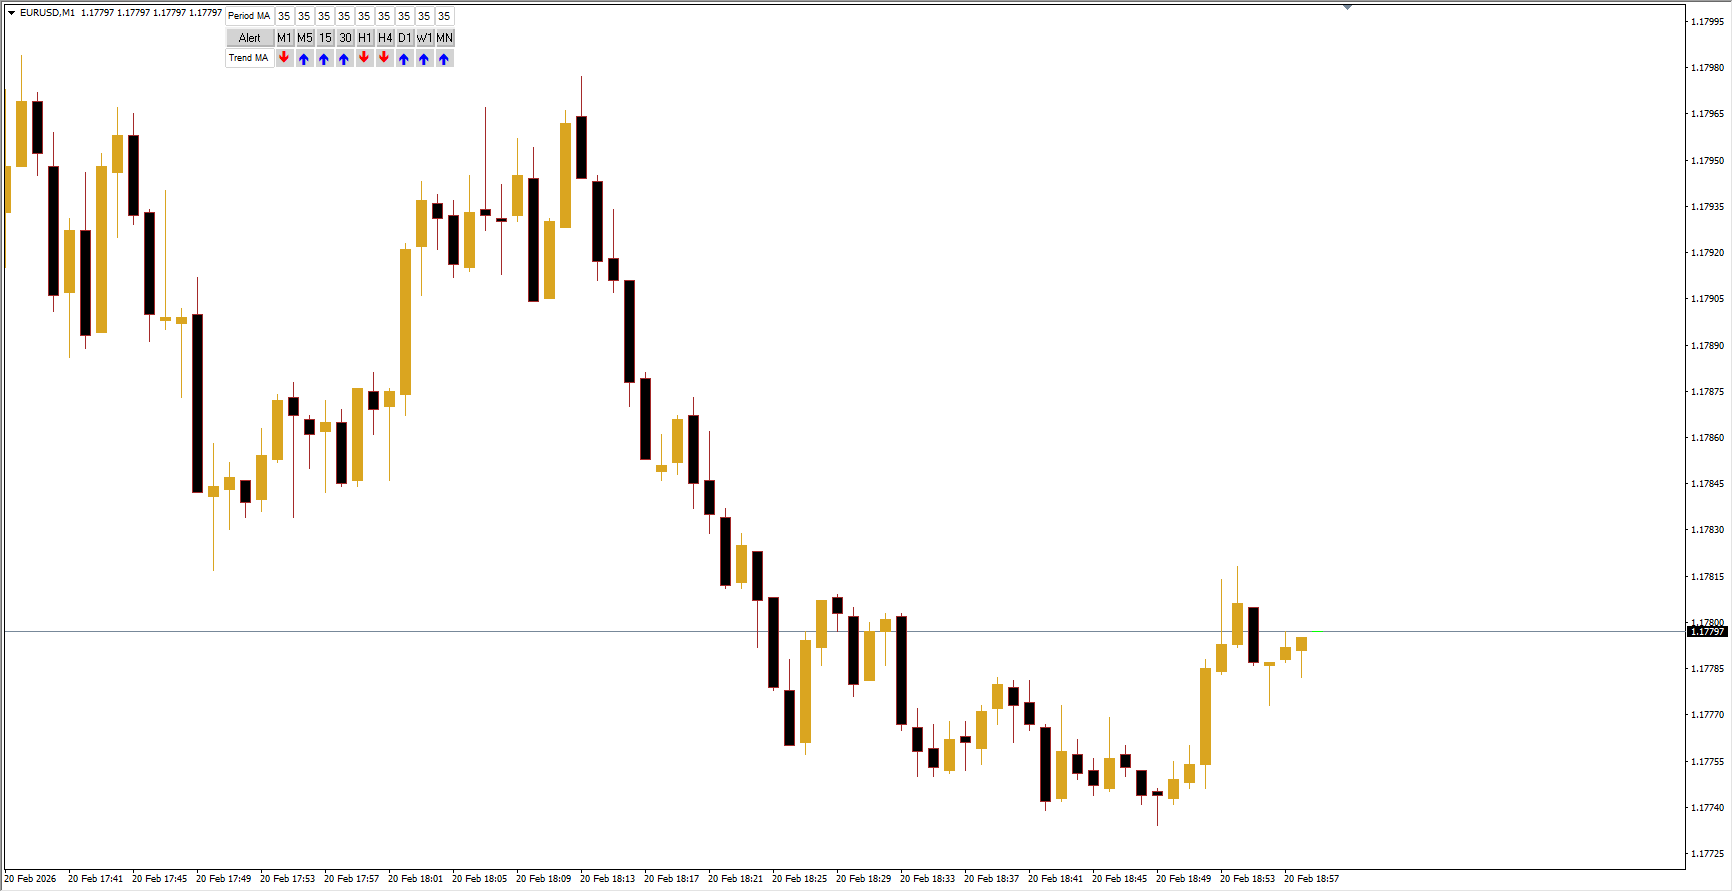
The MA Trend Indicator is a multi-timeframe tool designed for traders who rely on moving averages (MA) to analyze trends in forex, stocks, and other financial markets. Moving averages are one of the most popular technical analysis tools, but monitoring multiple timeframes simultaneously can be time-consuming. The MA Trend Indicator solves this problem by displaying all moving averages, periods, and trend directions in a single window, allowing traders to quickly gauge market conditions without switching charts.
How the MA Trend Indicator Works
The indicator provides a visual snapshot of long-term and short-term trends:
Blue arrow: Price is above the moving average (uptrend).
Red arrow: Price is below the moving average (downtrend).
Mixed arrows: Consolidation or sideways movement.
Neutral: Price is near the moving average line.
For example, if all arrows are blue across multiple timeframes, it indicates a strong uptrend. If all are red, it signals a strong downtrend. Mixed arrows indicate price consolidation.
Traders can adjust the moving average period for all timeframes or set different periods per timeframe depending on their strategy.
MA Trend Indicator Trading Strategy
Buying Strategy
Set the moving average period (e.g., 20) for the desired timeframes.
Enter a buy setup when all arrows are blue, indicating a strong uptrend.
Confirm with candlestick patterns (e.g., wait for a bullish candle to close on the 30-minute chart).
Place a market buy order.
Stop-loss: just below the recent swing low.
Take profit: near the next horizontal level or round number.
Selling Strategy
Set the moving average period (e.g., 20) for the desired timeframes.
Enter a sell setup when all arrows are red, indicating a strong downtrend.
Confirm with candlestick patterns (e.g., wait for a bearish candle to close on the 30-minute chart).
Place a market sell order.
Stop-loss: just above the recent swing high.
Take profit: near the next horizontal level or round number.
Conclusion
The MA Trend Indicator is a time-saving, multi-timeframe tool that helps traders quickly assess trend direction and strength. It simplifies trend analysis without the need to switch between charts. While highly effective for spotting trend setups, it is best used in combination with other indicators or Price Action analysis to maximize trading accuracy and reduce risk.
FAQ
2 Downloads
Published:
Feb 20, 2026 12:01 PM
Category: