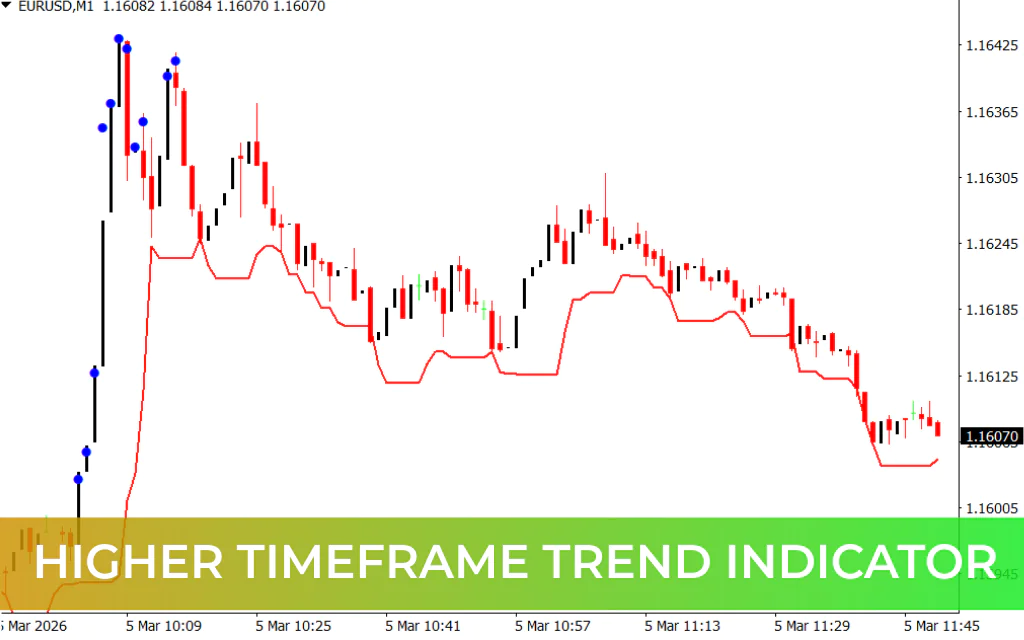
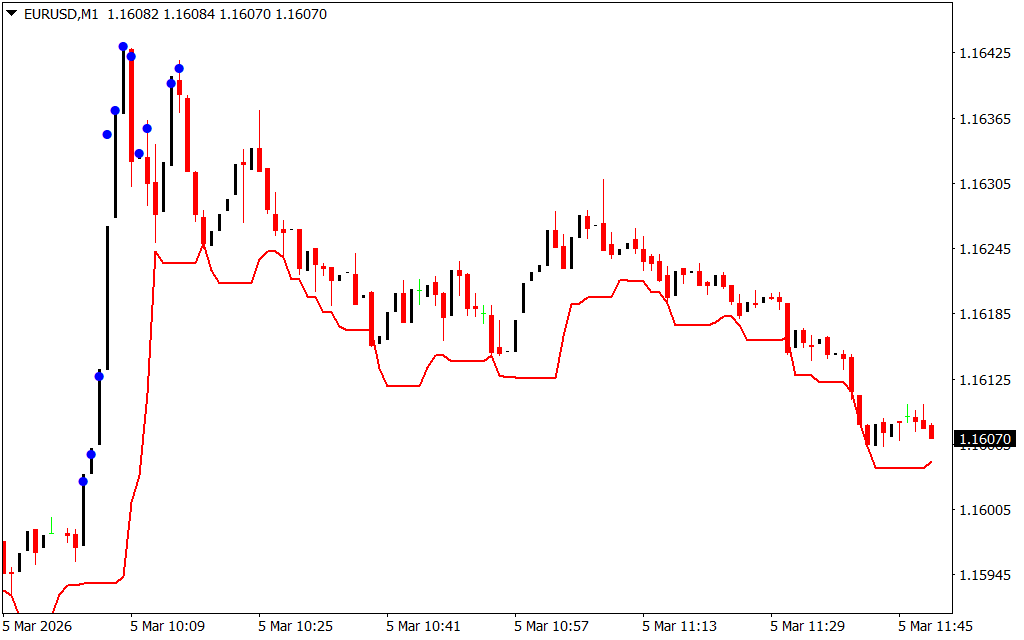
The Higher TimeFrame Trend Indicator for MT4 is a trend-following technical tool designed to help traders identify the overall market direction on higher timeframes. It combines calculations from the Relative Strength Index (RSI) and multiple Moving Averages (MA) to determine the strength and direction of the trend.
Instead of displaying the RSI and moving averages separately, the indicator processes their calculations and plots a single signal line on the chart. This approach keeps charts clean while still providing reliable trend information.
Because it is designed for higher timeframe analysis, the indicator works best on charts such as H4, Daily, or Weekly.
How the Higher TimeFrame Trend Indicator Works
The indicator analyzes RSI and multiple moving average values to determine market momentum and trend direction. The results are displayed through a color-coded signal line.
Signal Line Colors
- Green Line – indicates a bullish trend with strong upward momentum.
- Red Line – indicates a bearish trend with downward momentum.
- Grey Line – indicates market consolidation or sideways movement.
These color changes help traders quickly understand whether the market is trending or ranging.
How to Trade With the Higher TimeFrame Trend Indicator
Buy Setup
- Wait for the signal line to turn green, indicating bullish momentum.
- Confirm that the market is not moving sideways.
- Enter a buy trade once the upward trend is confirmed.
Sell Setup
- Wait for the signal line to turn red, indicating bearish momentum.
- Confirm strong downward movement in the market.
- Enter a sell trade aligned with the bearish trend.
Important Trading Tips
- The indicator performs best during strong trending markets.
- Signals may be less reliable during sideways or ranging conditions.
- Use additional tools such as support/resistance levels, Price Action, or other trend indicators to confirm trading signals.
Key Benefits
- Combines RSI and multiple moving average calculations
- Provides clear color-coded trend signals
- Designed for higher timeframe market analysis
- Keeps charts clean and easy to interpret
- Useful for swing and position trading strategies
Conclusion
The Higher TimeFrame Trend Indicator for MT4 is a simple yet effective tool for identifying the dominant market trend using RSI and moving average calculations. By focusing on higher timeframe momentum, it helps traders avoid short-term market noise and make more informed trading decisions.
For best results, combine this indicator with additional technical analysis tools to confirm trade entries and improve trading accuracy.
FAQ
Published:
Mar 05, 2026 05:51 AM
Category: