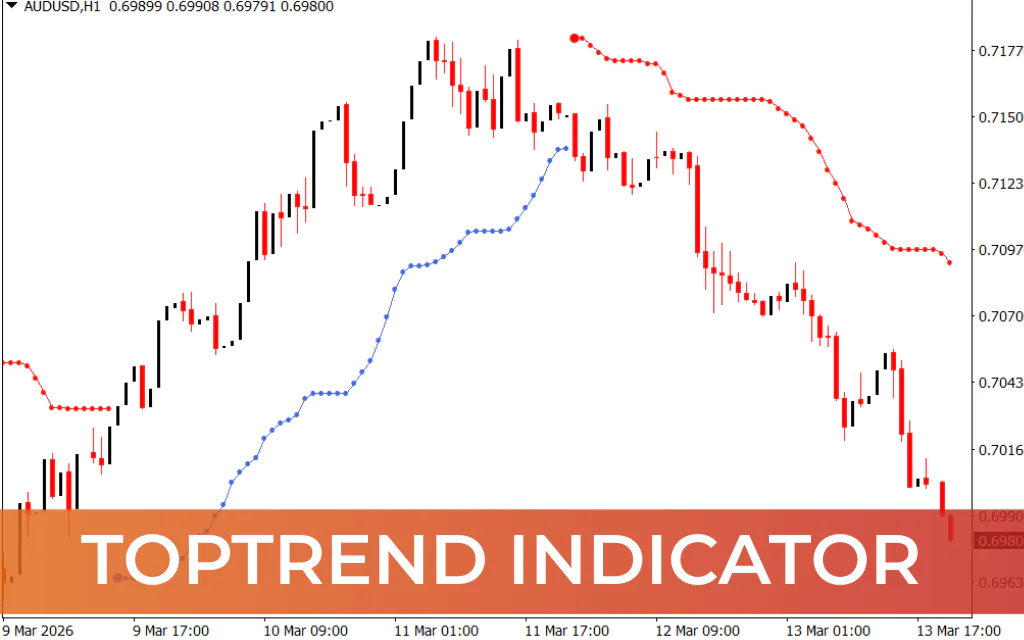
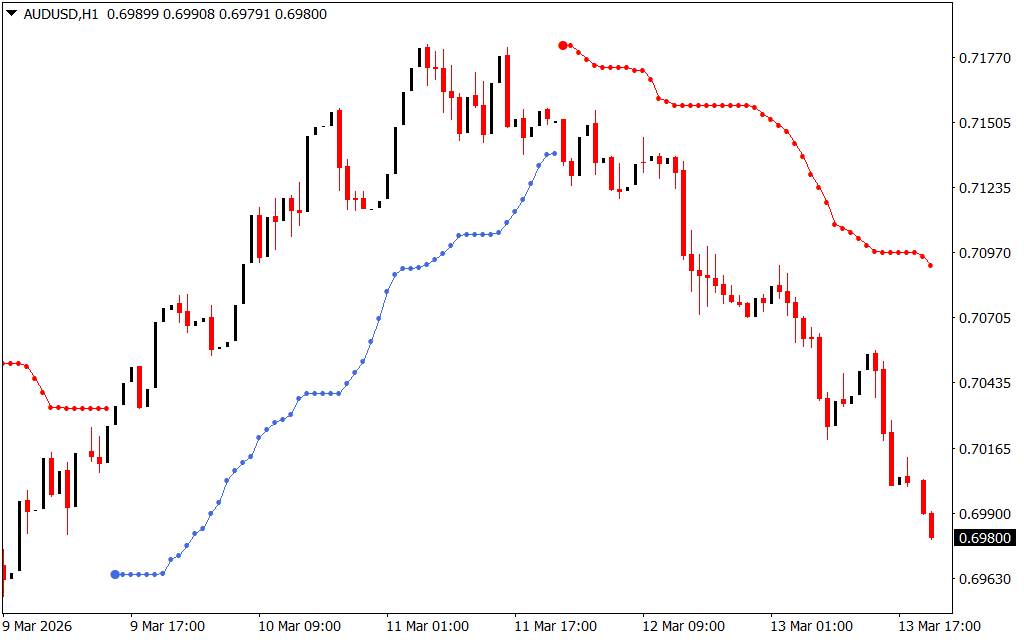
The TopTrend indicator for MT4 is a trend-following and breakout tool that helps traders identify potential price breakouts, trend reversals, and dynamic support/resistance levels. It’s designed to simplify market analysis by visually showing where price may decide its next direction.
The indicator works well for:
- Novice traders → easy-to-read trend insights and trading signals
- Advanced traders → aids in price-level analysis for more complex strategies
- Various assets → forex, stocks, commodities, cryptocurrencies, and more
How TopTrend Works
- Support & Resistance Lines → Plots dynamic S/R levels using a 20-period MA with a 2.0 deviation.
- Blue line below candles → bullish market support during an uptrend
- Red line above candles → bearish market resistance during a downtrend
- Trend Identification → The placement of the lines quickly shows whether the market is in an uptrend or downtrend.
- Timeframe Effectiveness → Works on all timeframes, but H1, H4, and Daily charts provide more consistent and reliable signals.
Trading Strategies Using TopTrend
- Pullback Entry within Current Trend
- Wait for the price to retrace toward the support/resistance line.
- Enter a buy near blue support or a sell near red resistance.
- Place stop-loss just below support (buy) or above resistance (sell).
- Breakout Trading
- Wait for price to break the current S/R line to identify a new trend.
- Enter the market in the direction of the breakout.
- Exit or take profits once the next support/resistance is tested.
Tip: Hold positions until the price breaks the current S/R level for maximum trend capture.
Advantages
✅ Plots dynamic support/resistance levels automatically
✅ Shows trend direction visually
✅ Works on multiple assets: forex, stocks, commodities, crypto
✅ Suitable for both novice and advanced traders
✅ Clear entry and exit zones based on trend and breakout levels
Limitations
⚠️ Conflicting signals may occur during sideways or range-bound markets
⚠️ Works best on higher timeframes for more reliable trends
Conclusion
The TopTrend indicator for MT4 is an efficient tool for trend-following and breakout strategies. It highlights potential price levels, trend direction, and breakout zones, making it easier for traders to make informed buy/sell decisions. While it’s beginner-friendly, advanced traders can use it in multi-timeframe analysis and confluence strategies.
FAQ
3 Downloads
Published:
Mar 14, 2026 08:48 AM
Category: