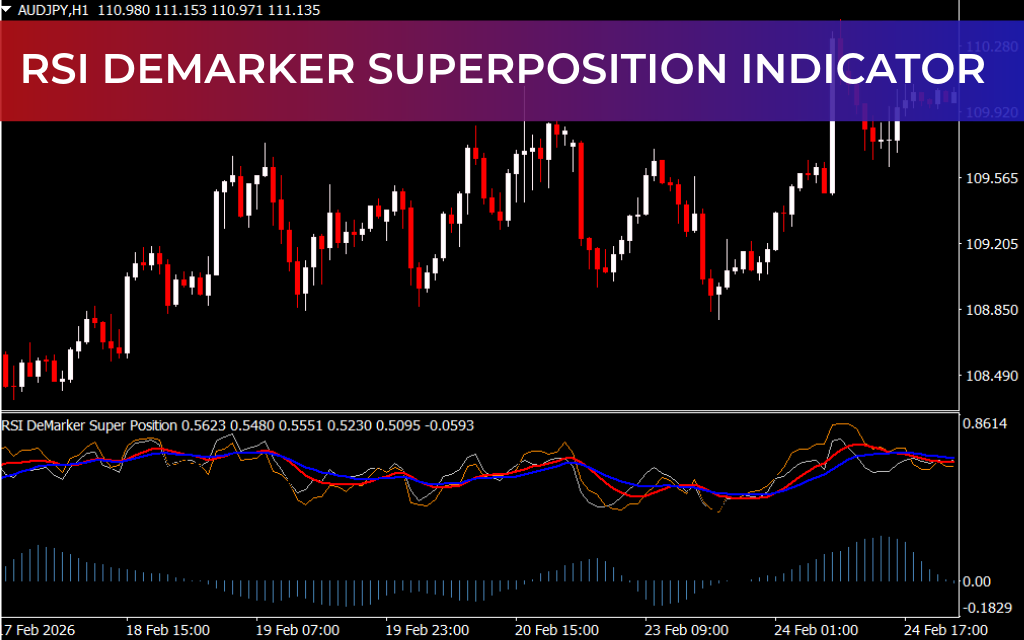
The RSI Demarker Superposition Indicator for MT4 is a technical trading tool that combines the power of two momentum oscillators—the Relative Strength Index (RSI) and the Demarker (DeM)—with a moving average to deliver more precise trend analysis. This harmonized approach helps traders filter false signals and spot high-probability trade setups.
Designed for MT4 users, the indicator also includes a histogram for added confluence, making trend detection and trade timing easier and more reliable.
What Is the RSI Demarker Superposition Indicator?
This indicator integrates three components:
- RSI (Relative Strength Index) – Measures momentum and overbought/oversold levels.
- Demarker (DeM) – Another momentum oscillator that reacts differently from RSI, adding complementary insights.
- Moving Average & Histogram – Tracks trend direction and provides confirmation for buy/sell signals.
By combining these, the RSI Demarker Superposition Indicator creates a comprehensive trend analysis tool that reduces false signals and increases confidence in trade entries.
How the Indicator Works
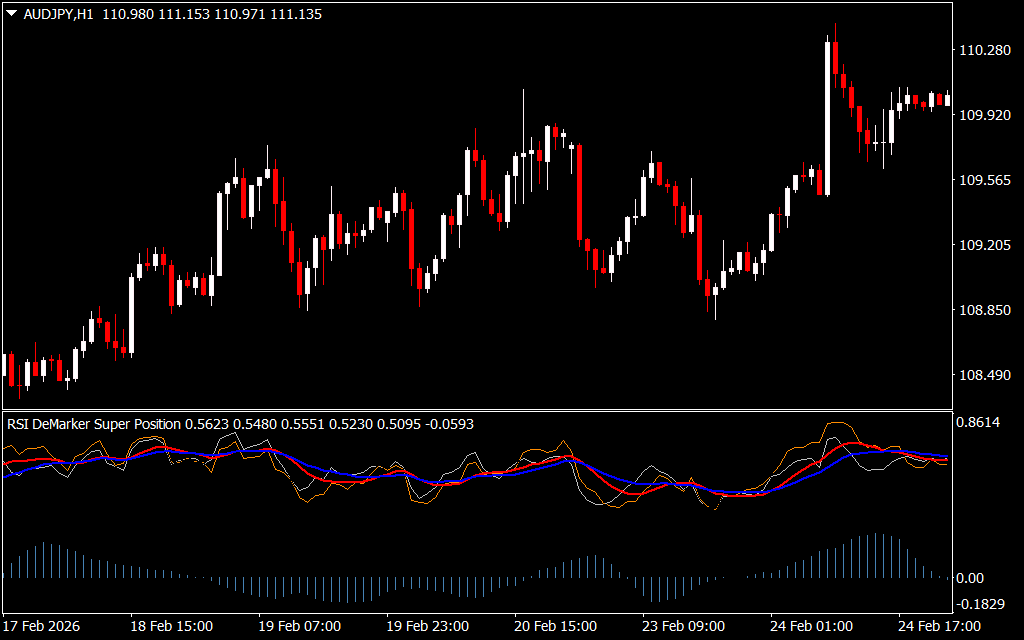
- The RSI and Demarker lines fluctuate above and below the moving average.
- A crossover above the moving average signals potential bullish momentum.
- A crossover below the moving average signals potential bearish momentum.
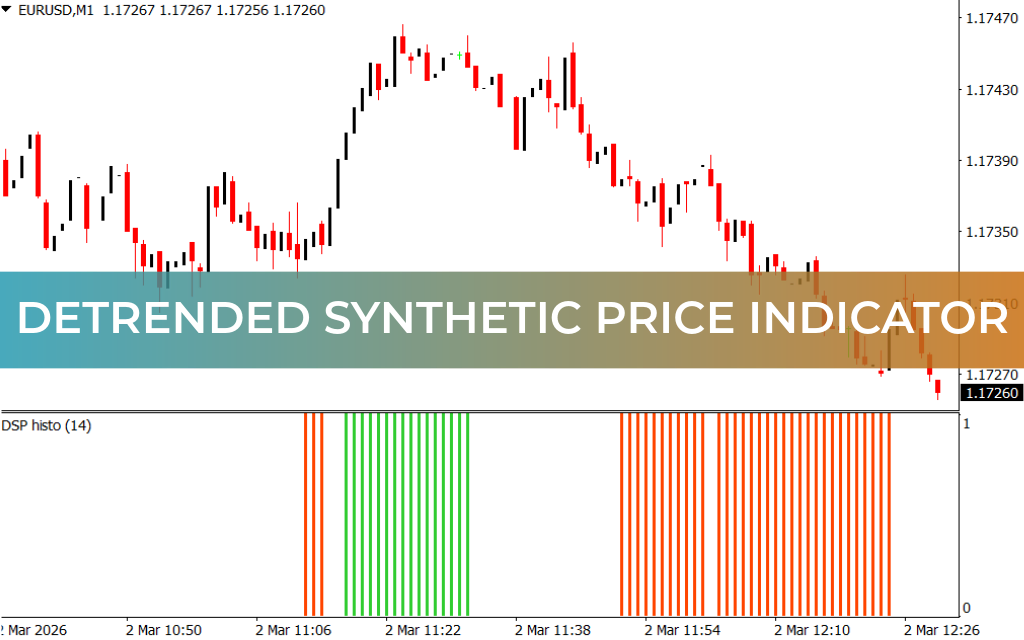
- The histogram provides a third layer of confirmation:
- Buy signals are stronger when the histogram is above the zero line.
- Sell signals are stronger when the histogram is below the zero line.
This multi-layered approach helps traders identify both trend direction and potential reversals with greater accuracy.
How to Trade with the RSI Demarker Superposition Indicator
Bullish Setup (Buy Signal)
- Wait for RSI and Demarker to cross above the moving average
- Confirm the signal with a histogram bar above zero
- Enter a long position
- Place stop loss below the recent swing low
Bearish Setup (Sell Signal)
- Wait for RSI and Demarker to cross below the moving average
- Confirm with a histogram bar below zero
- Enter a short position
- Place stop loss above the recent swing high
Benefits of the RSI Demarker Superposition Indicator
- Combines two momentum oscillators for stronger signal confirmation
- Includes a moving average to identify trend direction
- Histogram adds extra layer of confluence to reduce false signals
- Suitable for intraday, swing, and trend trading
- Helps spot trend reversals and optimal trade entries
Tips for Best Results
- Align with Higher Timeframe Trends – Ensure signals follow the broader market trend.
- Combine with Price Action – Use candlestick patterns or support/resistance to filter trades.
- Check Histogram Confirmation – Only take trades when the histogram aligns with the crossover signal.
- Multiple Timeframes – Analyze higher timeframes for trend context and lower timeframes for precise entries.
Conclusion
The RSI Demarker Superposition Indicator for MT4 is a robust trend analysis tool that harmonizes RSI and Demarker momentum oscillators with a moving average and histogram. By combining these elements, it provides reliable signals for trend reversals and trade entries, making it an essential tool for traders seeking accurate market analysis.
FAQ
Published:
Feb 28, 2026 17:51 PM
Category: