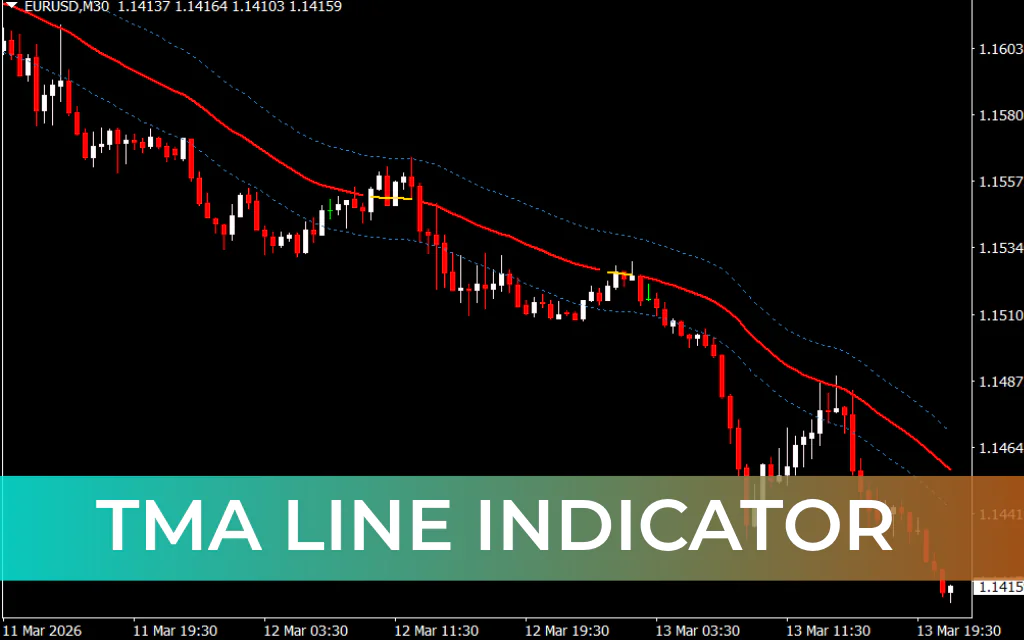
The TMA Line Indicator is a simple yet effective trend-following tool designed for MetaTrader 4. TMA stands for Triangular Moving Average, a type of moving average that smooths price data to provide clearer trend signals.
This indicator plots three main components on the chart:
- A central trend line
- An upper band
- A lower band
Visually, the indicator looks similar to Bollinger Bands, where the outer bands act as dynamic Support And Resistance levels. These levels help traders identify potential entry and exit points in the market.
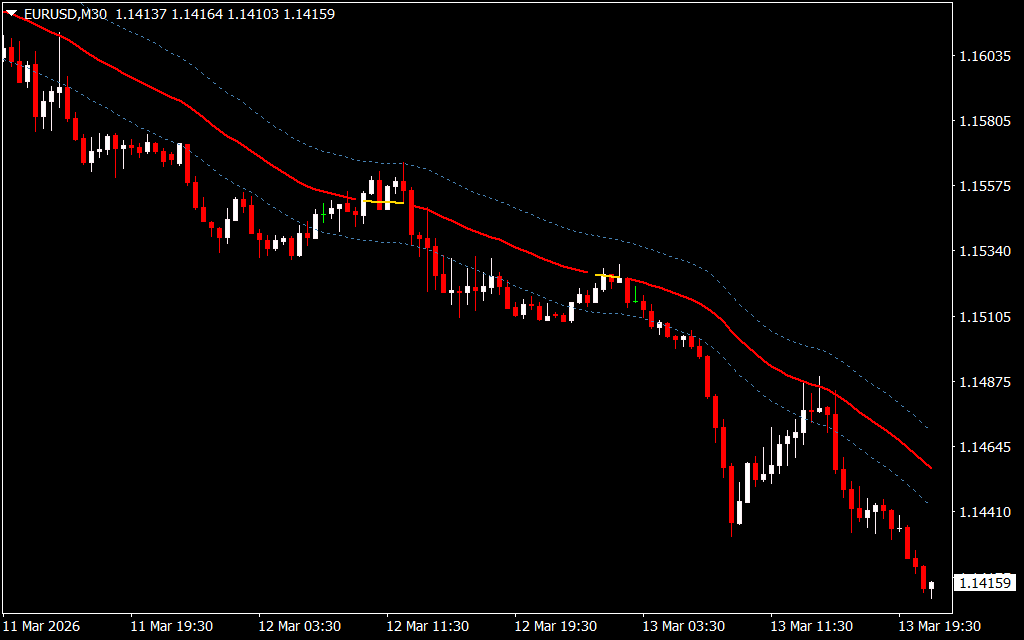
The central line of the TMA indicator changes color depending on market conditions, allowing traders to quickly determine the current trend direction.
How the TMA Line Indicator Works
The TMA indicator analyzes price and volume data to produce smoothed trend signals. The central line acts as the primary trend detector and changes color based on market direction.
Central Line Colors
- Green Line – Indicates a bullish trend
- Red Line – Indicates a bearish trend
- Yellow Line – Indicates market neutrality
When the line turns yellow, it means the market is ranging and neither buyers nor sellers are in control. During such conditions, it is usually best to avoid entering trades.
The upper and lower bands function as dynamic support and resistance levels, helping traders identify potential price reversals or breakout zones.
How to Trade the TMA Line Indicator
The central line provides the main entry and exit signals for trades.
- Green central line → Look for buy opportunities
- Red central line → Look for sell opportunities
- Yellow central line → Avoid trading due to low Trend Strength
The indicator’s period settings can also be customized depending on your trading strategy.
For example:
- Short-term strategies → Lower periods such as 10
- Long-term strategies → Higher periods for smoother signals
TMA Line Indicator Buy Strategy
Follow these steps for a buy setup:
- The central line turns green, indicating a bullish trend.
- Wait until the green line fully forms.
- Enter a buy trade near the central line.
- Place the stop-loss near the recent swing low.
- Exit the trade when the central line changes color.
This setup suggests that buyers are controlling the market.
TMA Line Indicator Sell Strategy
Follow these steps for a sell setup:
- The central line turns red, indicating a bearish trend.
- Wait for the red line to fully develop.
- Enter a sell trade near the central line.
- Place the stop-loss near the recent swing high.
- Exit the trade when the central line changes color.
This setup indicates increasing selling pressure in the market.
Trading Tips
To improve the accuracy of TMA signals:
- Adjust the indicator period according to your trading style.
- Use the upper and lower bands as support and resistance levels.
- Combine the indicator with other technical tools such as the Relative Strength Index (RSI) or Moving Average Convergence Divergence (MACD).
Combining indicators can help confirm signals and reduce the chances of false trades.
Conclusion
The TMA Line Indicator is a useful tool for traders who want to identify market trends and key price levels. By smoothing price data with triangular moving averages, it helps remove noise and highlight clearer trading opportunities.
Because it provides visual trend signals and dynamic support/resistance levels, the indicator works well on any timeframe and can be adapted to different trading strategies.
FAQ
4 Downloads
Published:
Mar 14, 2026 08:00 AM
Category: