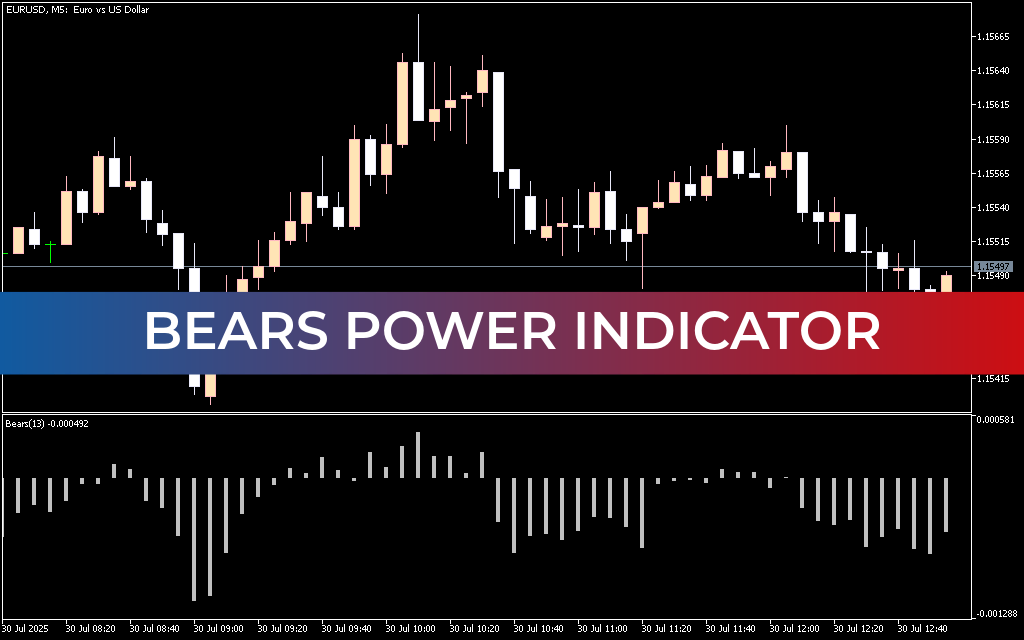
The Bears Power Indicator for MetaTrader 5 (MT5) is a technical analysis tool designed to measure the strength of sellers (bears) in the market. It helps traders understand whether bearish momentum is increasing or weakening by analyzing the relationship between price and a moving average.
As the opposite of Bulls Power, this indicator focuses on identifying selling pressure, trend reversals, and potential short entry opportunities across forex, stocks, and cryptocurrencies.
How the Bears Power Indicator Works
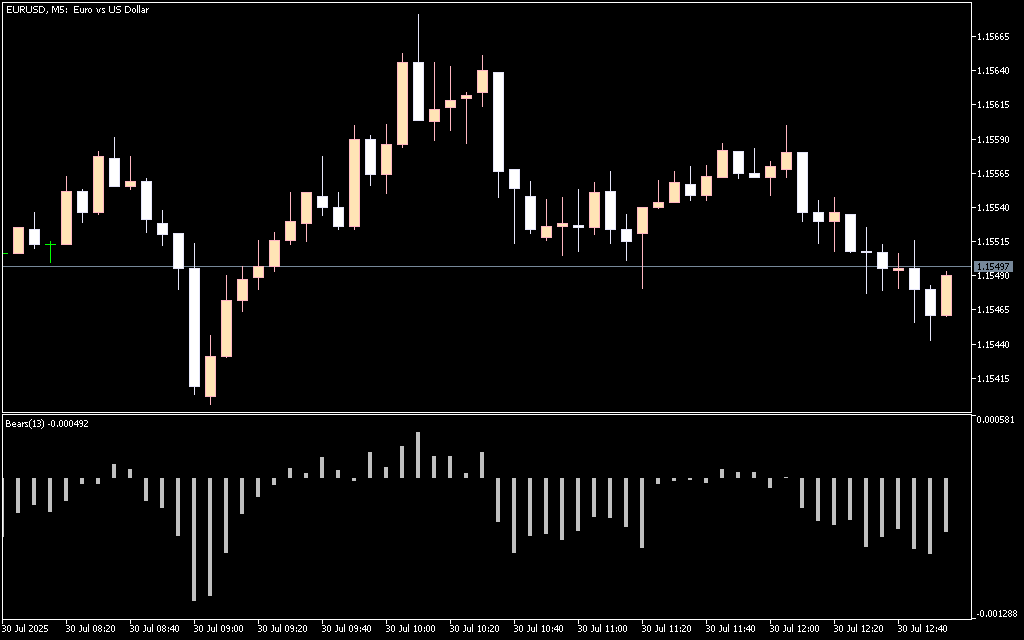
The indicator uses a histogram to represent bearish strength:
- Histogram Below Zero Line: Indicates strong bearish pressure
- Histogram Near Zero Line: Indicates weak or neutral market conditions
- Deeper Negative Values: Suggest stronger selling momentum
It compares the lowest price of each period with a moving average to determine how strong sellers are in the market.
Trading Signals Explained
🔹 Sell Signal (Bearish Entry)
- Histogram moves below the zero line
- Price shows rejection at resistance or breaks support
- Indicates increasing bearish momentum
Entry Strategy:
- Enter sell trades when bearish confirmation appears
- Use break of support or bearish candlestick patterns for confirmation
- Place stop-loss above recent swing highs
🔹 Exit Signal (Buy/Close Sell)
- Histogram moves above the zero line
- Indicates weakening bearish pressure
- Suggests closing short positions or avoiding new sells
How to Trade with Bears Power Indicator
A practical approach:
- Identify key resistance levels
- Wait for price rejection or breakdown of support
- Confirm that the Bears Power histogram is below zero
- Enter a sell trade after confirmation
- Exit when the histogram crosses above zero or shows weakening momentum
Key Features
- Measures bearish strength and selling pressure
- Histogram-based visual representation
- Works across multiple timeframes (MTF compatibility)
- Suitable for forex, stocks, and crypto markets
- Helps identify trend continuation and reversals
- Easy to interpret for all trader levels
Best Usage Tips
- Combine with trend indicators like moving averages, MACD, or stochastic
- Use alongside Support And Resistance levels for confirmation
- Avoid trading in sideways or low-volatility markets without additional signals
- Always apply proper risk management
- Test strategies on a demo account before live trading
Who Should Use Bears Power Indicator?
- Trend Traders – to confirm bearish trends
- Swing Traders – to capture medium-term downtrends
- Intraday Traders – for short-term sell setups
- Algorithmic Traders – for automated bearish strategies
Conclusion
The Bears Power Indicator for MT5 is a reliable tool for measuring selling pressure and identifying bearish market conditions. By analyzing histogram values relative to the zero line, traders can better understand Trend Strength and potential entry or exit points.
When combined with other technical indicators and Price Action analysis, it becomes a powerful component of a complete trading strategy, especially for spotting sell opportunities in trending markets.
FAQ
Published:
Mar 24, 2026 09:54 AM
Category: