Free
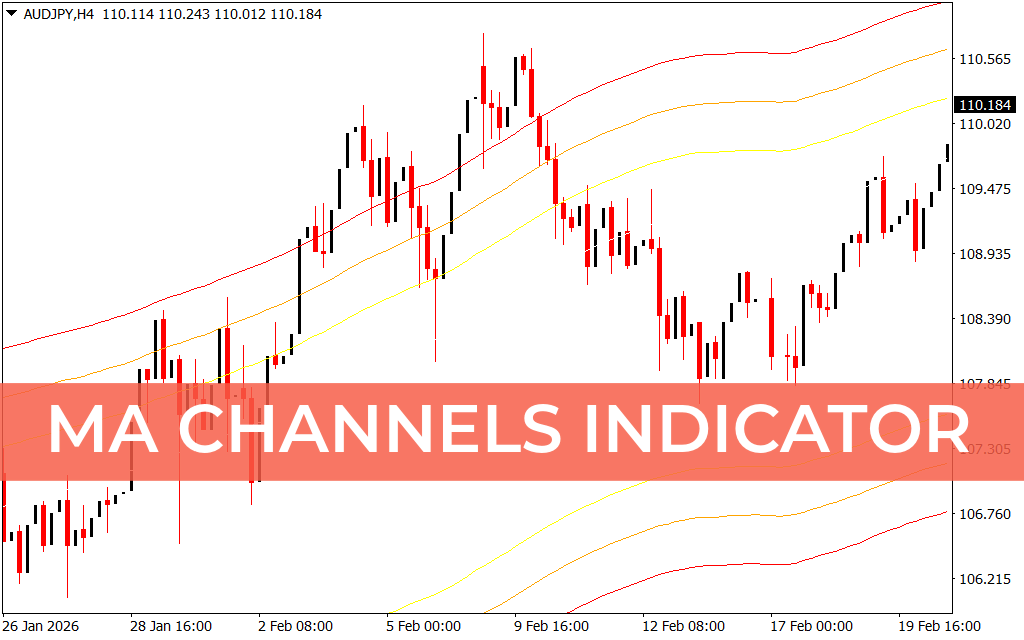
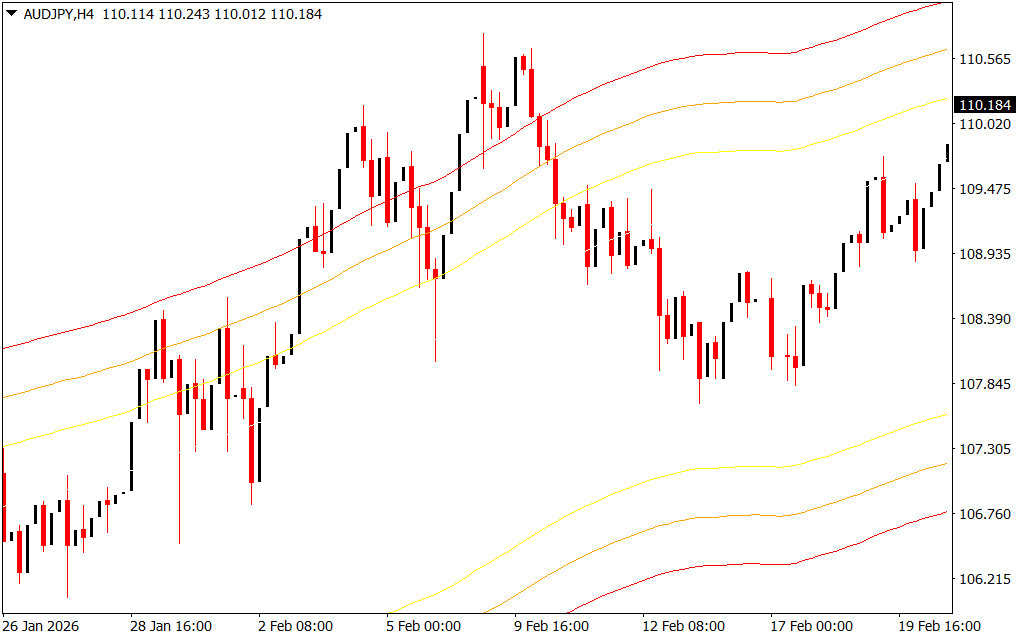
The MA Channels Indicator for MT4 plots Fibonacci channels above and below the 100-period moving average, helping traders identify overbought and oversold levels and reliable entry and exit points. By combining moving averages with Fibonacci levels, this indicator provides precise trading signals for short-term and intraday strategies.
Key Features of MA Channels
- Channel Levels:
- White Line: 23.5%
- Yellow Line: 38.2%
- Orange Line: 50%
- Red Line: 61.8%
These lines form channels above and below the 100-period moving average.
- Trend Identification: Helps detect potential trend reversals when price reaches extreme channel levels.
- Multi-Timeframe Compatibility: Works on all intraday, short-term, and long-term price charts.
- Automated Trading Ready: Channels can be used in algorithmic trading strategies.
How to Trade Using MA Channels
- Sell Trades: When the price exceeds the upper red line (61.8%), wait for a retracement below the line. Enter a sell position with a stop above the previous swing high. Target the opposite side of the channel for profit.
- Buy Trades: When the price drops below the lower red line (61.8%), enter a buy position. Place a stop below the previous swing low and target the upper channel line for profit.
- Strategy Concept: This indicator functions similarly to overbought and oversold trading strategies, allowing traders to act when prices revert from extreme levels.
Benefits of MA Channels
- Provides clear visual Support And Resistance zones based on Fibonacci levels.
- Effective for both new and advanced traders.
- Suitable for all chart timeframes and trading styles.
- Integrates easily into automated trading systems.
Conclusion
The MA Channels Indicator for MT4 is a versatile and essential tool for traders who rely on channel-based and Fibonacci strategies. By clearly identifying potential reversal points and trend extremes, it enhances precision in forex trading and supports both manual and automated trading approaches.

FAQ
A 100-period moving average centres the structure while Fibonacci percentage sleeves—commonly 23.6 through 61.8 tiers—colour-code how far price may stretch before mean reversion statistics kick in.
Wait for clear rejection from the outer band: sells when price stretches above in overbought context, buys when it dives below in oversold context, always with stops beyond the spike that proved the fade wrong.
Opposite channel boundary or mid-MA magnet often supplies logical partial zones—scale out instead of expecting every touch to reach the farthest rail instantly.
Vendor text mentions buffer-driven automation—forward-test because MA-centred channels lag sudden regime breaks.
Treat bands as statistical zones, not prophecy—some weeks price rides one side relentlessly; adapt size when that happens.
1 Download
Published:
Mar 28, 2026 22:02 PM
Category:
Share: