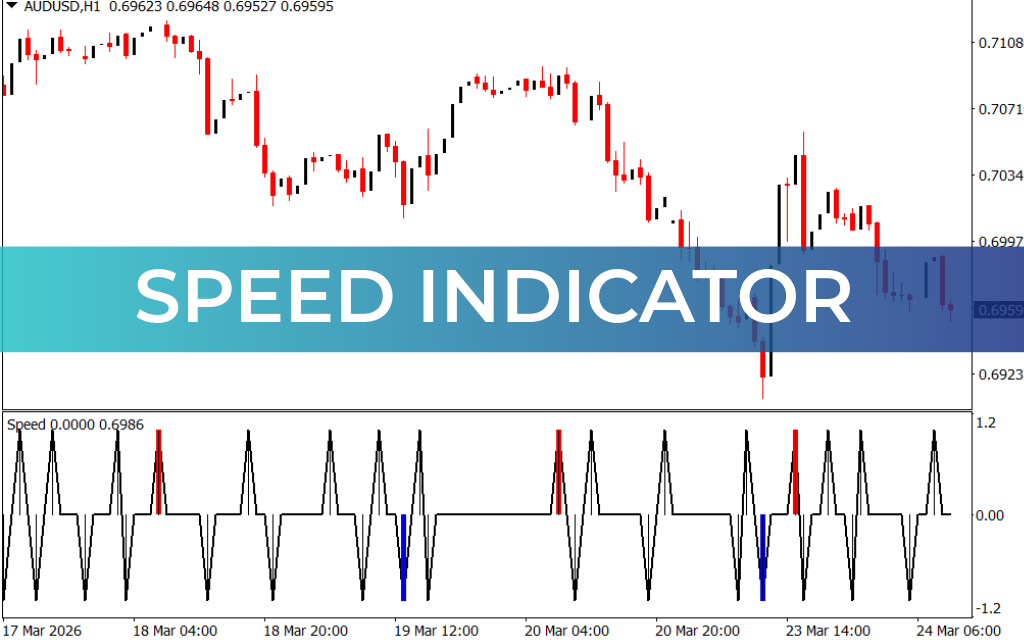
The Speed Indicator for MetaTrader 4 (MT4) is a momentum-based oscillator designed to measure the speed and strength of the current market trend. By oscillating between -1.2 and 1.2, the indicator helps traders quickly assess whether momentum is increasing or decreasing.
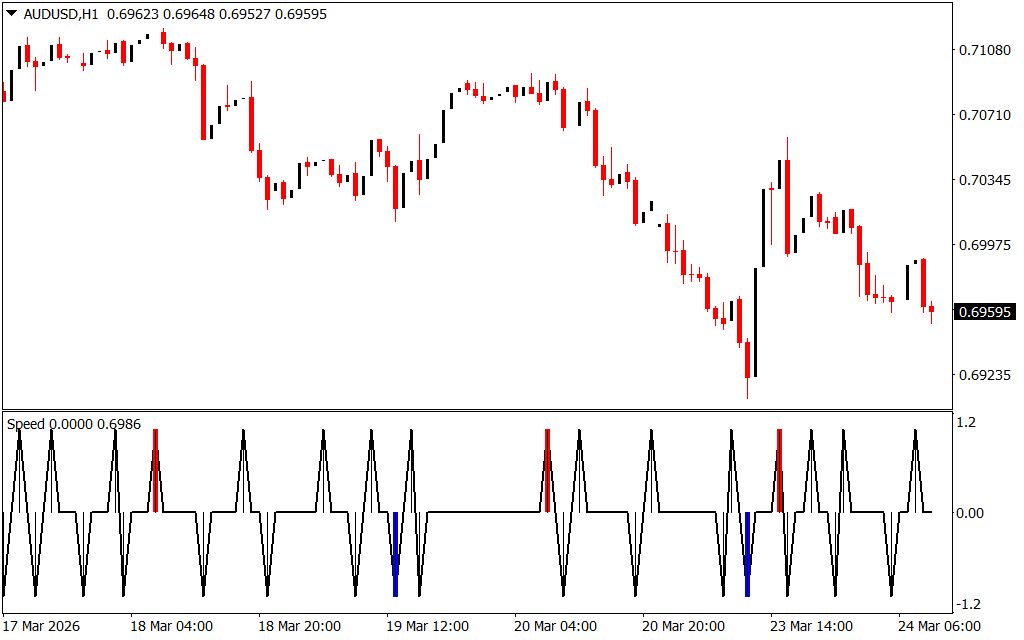
It provides clear visual buy and sell signals using color-coded histogram bars, making it easy to interpret for both beginners and experienced traders.
Key Features of the Speed Indicator
- Oscillates between -1.2 and 1.2 to measure trend speed
- Blue bars indicate bullish momentum
- Red bars indicate bearish momentum
- Helps identify Trend Strength and continuation
- Works across all timeframes (best on higher timeframes)
- Simple and easy-to-use interface
How the Indicator Works
The Speed Indicator displays histogram bars that reflect both direction and intensity of market movement:
- Blue bars: Indicate bullish trend and upward momentum
- Red bars: Indicate bearish trend and downward momentum
The oscillator value shows how strong the trend is:
- Values closer to 1.2: Strong bullish momentum
- Values closer to -1.2: Strong bearish momentum
- Values near 0: Weak or ranging market
Trading Strategy
Buy Setup
- A blue bar appears
- Momentum is increasing toward the positive range
- Enter a buy trade
- Place stop loss below the recent swing low
Sell Setup
- A red bar appears
- Momentum is moving toward the negative range
- Enter a sell trade
- Place stop loss above the recent swing high
Trend Strength Analysis
- Rising values indicate strengthening momentum
- Falling values suggest weakening trend
- Use this to hold trades longer or exit early
Best Timeframes to Use
While the indicator can be applied to any chart:
- Higher timeframes (H1, H4, Daily): More reliable signals
- Lower timeframes: Faster signals but higher risk of false entries
Why Use the Speed Indicator?
- Quickly measures both direction and strength of trends
- Helps avoid weak or choppy market conditions
- Improves trade timing and confidence
- Complements other technical indicators
Conclusion
The Speed Indicator for MT4 is a simple yet powerful tool for analyzing market momentum. By oscillating between -1.2 and 1.2 and displaying clear bullish and bearish signals, it helps traders identify trend strength and make more informed trading decisions.
FAQ
9 Downloads
Published:
Mar 24, 2026 05:56 AM
Category: