The Commodity Channel Index (CCI) Indicator, originally developed by Donald Lambert, is a powerful technical tool widely used by forex traders to identify emerging trends and detect potential market reversals. One of its key strengths is spotting divergence between price and the indicator, which often signals weakening momentum and a possible change in trend direction. As an oscillator, the CCI can also help identify potential overbought and oversold market conditions.
Commodity Channel Index MT4 Indicator Trading Strategy
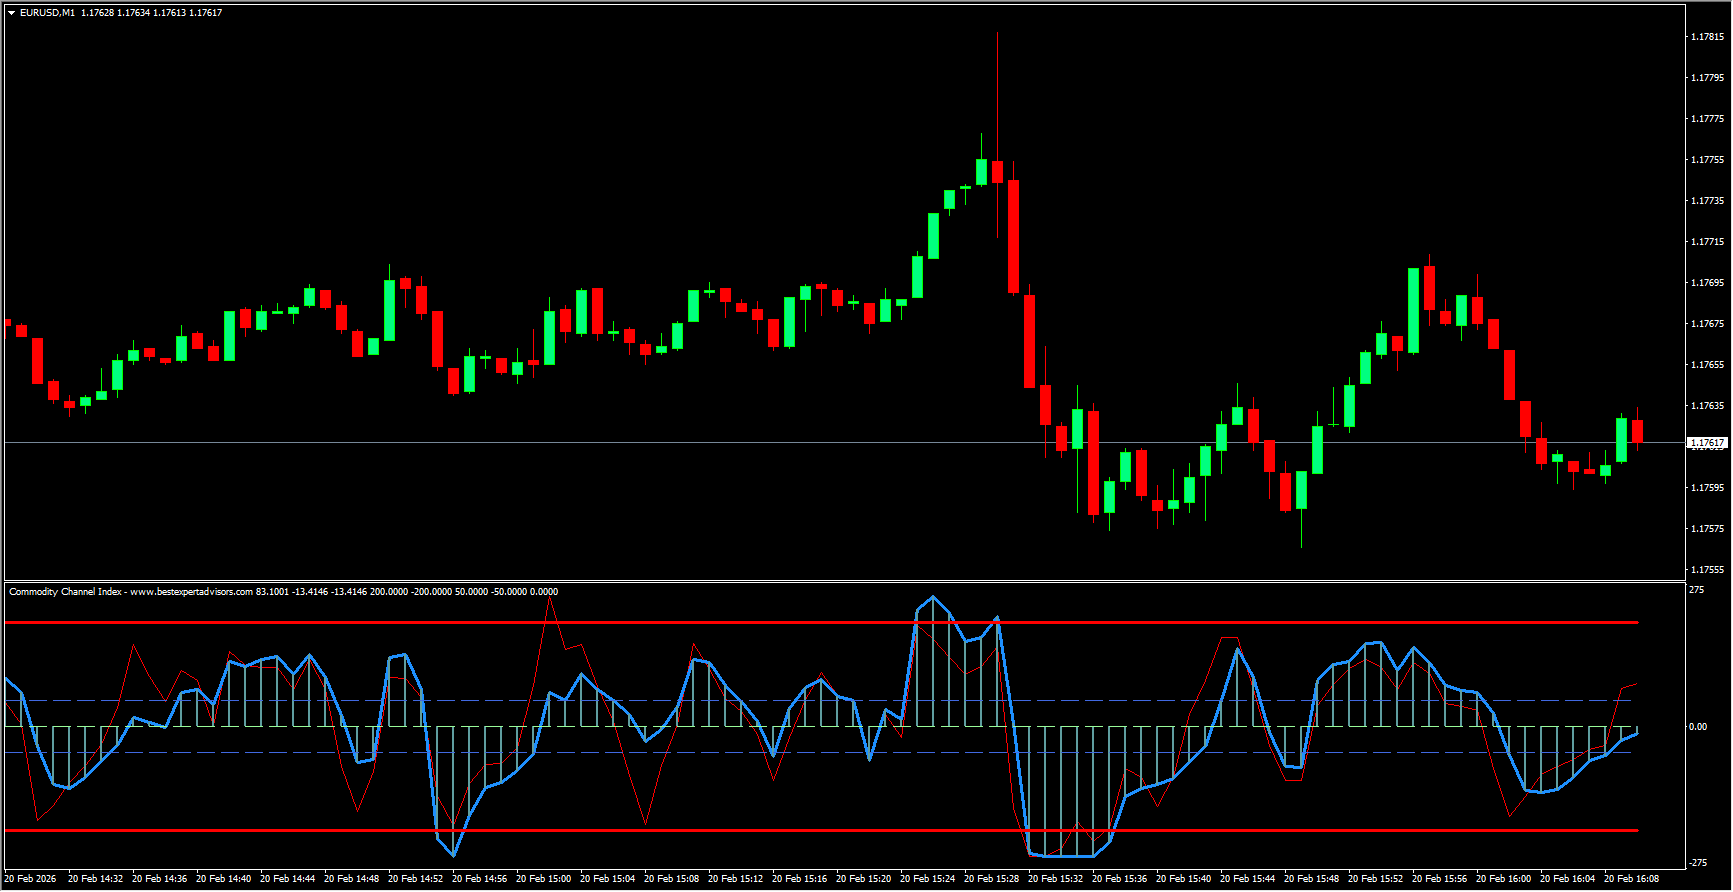
On a typical chart, the CCI displays key reference levels to help traders interpret market momentum:
+200 and -200 levels (bold red lines) indicate extreme overbought and oversold zones.
Zero line (pale green) represents the midpoint of momentum.
+50 and -50 trigger levels (royal blue) act as entry signals.
Turbo CCI line (red) reacts faster to price changes.
Standard CCI line (dodger blue) reflects overall momentum direction.
When to Buy and Sell
Buy Signal
When both the Turbo CCI and standard CCI move above the +50 trigger level.
Hold the position while momentum remains strong.
Exit when both lines drop below the zero line.
Sell Signal
When both the Turbo CCI and standard CCI move below the -50 trigger level.
Stay in the trade while bearish momentum continues.
Exit when both lines rise above the zero line.
Why Traders Use the CCI Indicator
The CCI is especially helpful for beginners because it clearly highlights entry and exit trigger levels. Experienced traders, however, often rely on it to detect divergence and scale into positions as trends strengthen or weaken.
Despite its name, the CCI is not limited to commodities—it works effectively across forex pairs, indices, and other financial instruments. Unlike many oscillators with fixed ranges, the CCI is an unbounded indicator, meaning its values can extend indefinitely in either direction. Because of this, overbought or oversold conditions may persist longer than expected. For this reason, traders should always confirm signals using Price Action analysis.
Conclusion
The Commodity Channel Index MT4 indicator helps traders understand the relative strength or weakness of price movement compared to historical averages. Its ability to reveal divergence and measure trend momentum makes it a valuable component of many trading strategies. However, for best results, traders should combine CCI signals with price action confirmation to improve accuracy and manage risk effectively.
FAQ
Published:
Feb 20, 2026 09:14 AM
Category: