The Traders Dynamic Index (TDI RT Alerts Divergence) is a powerful fusion indicator that allows traders to analyze the market from multiple perspectives at once. It helps determine:
Trend direction
Market sentiment
Volatility levels
Potential divergence setups
Because of its integrated structure, the TDI can function as a complete trading system on its own.
What is the TDI Indicator?
The Traders Dynamic Index was developed in 2005 by Dean Malone as a comprehensive market condition indicator.
The TDI is built on the foundation of the Relative Strength Index (RSI), enhanced with:
Moving Averages (for signal smoothing)
Bollinger Bands (for volatility measurement)
This combination transforms a simple momentum oscillator into a multi-layered trading tool.
TDI Indicator Components Explained
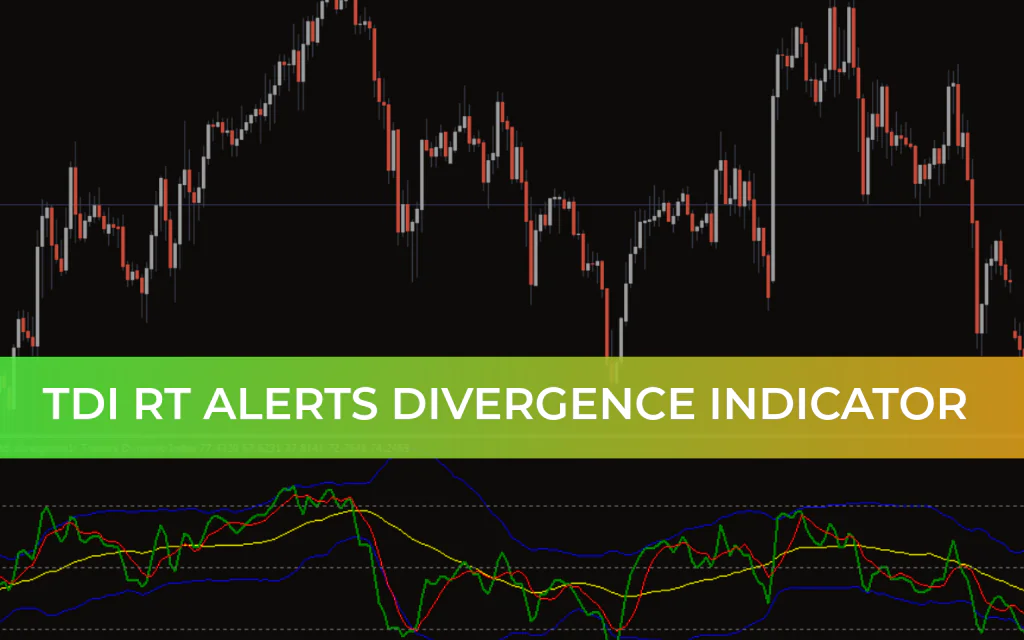
The indicator consists of five key lines:
🟢 Green Line – RSI (Market Sentiment)
Represents short-term price momentum and reflects how the market reacts to buying and selling pressure.
🔴 Red Line – Signal Line
A moving average of the green line. Crossovers between green and red generate entry and exit signals.
🟡 Yellow Line – Market Baseline
Represents the broader market trend. This is the most important line for identifying long-term direction.
🔵 Blue Bands – Volatility Bands
Similar to Bollinger Bands, these lines expand and contract based on volatility levels.
Expanding bands → Increasing volatility
Contracting bands → Decreasing volatility
Strong contraction often precedes major market moves, especially before important news releases.
How to Use the TDI Indicator
1️⃣ Identifying Trend Direction
Green above Red → Short-term bullish momentum
Green below Red → Short-term bearish momentum
For stronger confirmation:
Green above both Red and Yellow → Strong bullish condition
Green below both Red and Yellow → Strong bearish condition
2️⃣ Using the Yellow Market Baseline
The yellow line helps identify the broader trend:
Rising yellow line → Bullish Market Structure
Falling yellow line → Bearish market structure
When price rejects or reacts strongly near the yellow line, it may signal a trend continuation or reversal.
3️⃣ Measuring Trend Strength
Steep slope of green line → Strong momentum
Flat green line → Weak or inactive market
Avoid trading when lines move horizontally, as it indicates low momentum and potential consolidation.
4️⃣ Monitoring Volatility
Bands widening → Volatility increasing
Bands narrowing → Volatility decreasing
Extreme narrowing often signals an upcoming breakout.
TDI Trading Strategy
The TDI works best on H1 timeframe and higher for more reliable signals. It is suitable for both short-term and medium-term trading.
✅ TDI Buy Setup
Green line above Red and Yellow lines
Wait for a bullish confirmation candle
Enter after confirmation
Place stop-loss near the recent swing low
Exit when Green crosses below Red
✅ TDI Sell Setup
Red line above Green and Yellow lines
Wait for a bearish confirmation candle
Enter after confirmation
Place stop-loss near the recent swing high
Exit when Red crosses below Green
Why Use the TDI RT Alerts Divergence?
✔ Combines momentum, trend, and volatility in one indicator
✔ Helps filter false signals
✔ Suitable for major forex pairs
✔ Works well on H1 and higher timeframes
✔ Can function as a standalone system
For best results, use it on assets with stable volatility, such as major forex pairs, and avoid trading during major economic announcements.
Conclusion
The TDI RT Alerts Divergence indicator for MT4 is a comprehensive and versatile trading tool. By combining RSI, moving averages, and volatility bands, it provides traders with a complete picture of market conditions.
When used properly — especially with confirmation from Price Action — it can significantly improve timing, trend identification, and overall trade accuracy.
FAQ
4 Downloads
Published:
Feb 20, 2026 11:47 AM
Category: