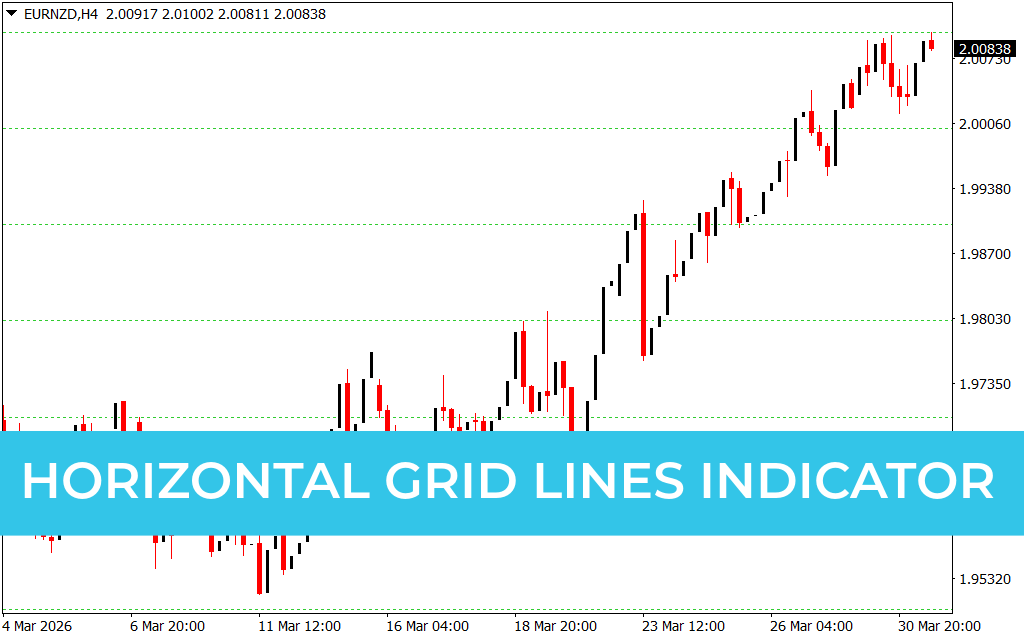
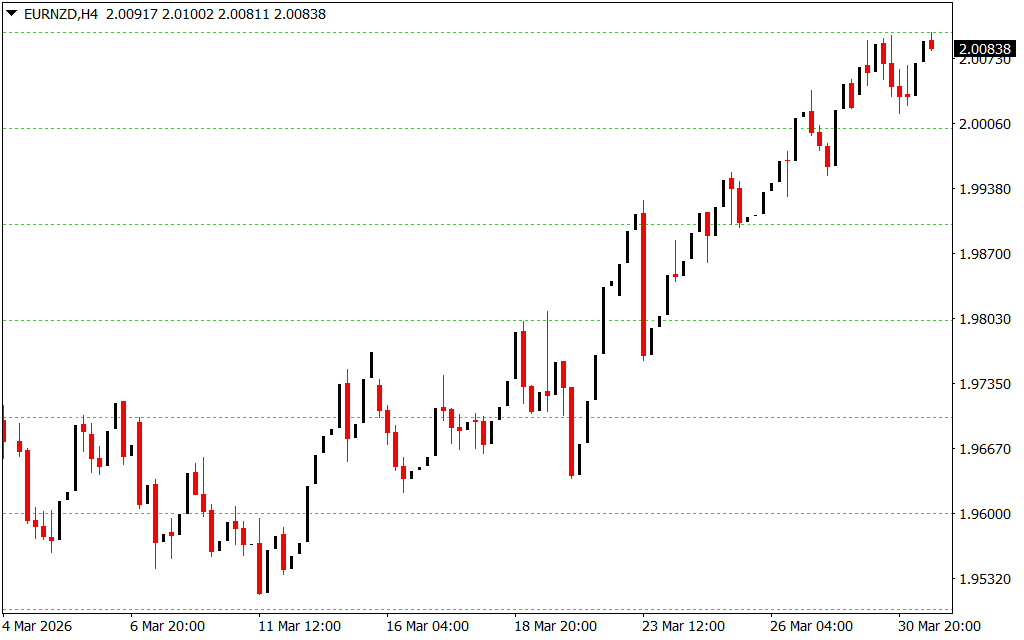
The Horizontal Grid Lines Indicator is a powerful yet easy-to-use MetaTrader 4 tool that plots evenly spaced horizontal lines across your trading chart. These lines help traders uncover hidden market structures, making it easier to identify key price zones for opening or closing trades.
This indicator is suitable for beginners as well as advanced traders who want to improve their understanding of support, resistance, and price behavior.
How the Indicator Works
The Horizontal Grid Lines Indicator draws two types of lines:
- Gray Dotted Lines: Represent equidistant price levels (default spacing is 200 points or 20 pips)
- Green Dotted Lines: Highlight psychological price levels (e.g., 0.00 levels)
These lines act as visual guides, helping traders recognize important zones where price reactions are likely to occur.
Key Features of Horizontal Grid Lines Indicator
1. Automatic Grid Line Plotting
The indicator automatically draws horizontal lines across the chart for quick analysis.
2. Adjustable Spacing
You can customize the distance between lines to match your trading strategy.
3. Psychological Price Levels
Highlights key round-number levels where major market decisions often happen.
4. Works on Multiple Timeframes
Can be applied to H1, H4, and other timeframes for flexible trading.
How to Use the Horizontal Grid Lines Indicator
Follow these simple steps:
- Install the indicator on your MT4 platform
- Open any forex chart (e.g., EUR/USD H1)
- Attach the indicator to the chart
- Adjust spacing settings if needed
Once applied, you will see horizontal lines that divide the chart into equal sections, making it easier to analyze price movements.
Trading Strategies Using Horizontal Grid Lines
1. Support And Resistance Trading
The grid lines act as dynamic support and resistance levels. Price often reacts around these zones, providing high-probability trade setups.
2. Trend Reversal Identification
Look for reversal patterns such as:
- Double tops
- Double bottoms
- Pin bars
When these patterns form near grid lines, they can signal strong reversal opportunities.
3. Breakout Trading
Traders can use the lines to identify breakout zones. A strong move beyond a grid line may indicate the start of a new trend.
Why Traders Use This Indicator
Many traders overlook simple tools like grid lines, but they provide valuable insights into Market Structure. This indicator helps:
- Identify optimal entry and exit points
- Track psychological price levels
- Improve trade accuracy
- Enhance overall trading performance
Conclusion
The Horizontal Grid Lines Indicator for MT4 is a simple yet highly effective trading tool that helps traders identify key price zones with ease. By acting as dynamic support and resistance levels, it improves both trend analysis and trade execution.
👉 Visit IndicatorForest.com today to download the Horizontal Grid Lines Indicator for free and upgrade your trading strategy.
5 Downloads
Published:
Mar 31, 2026 07:11 AM
Category: