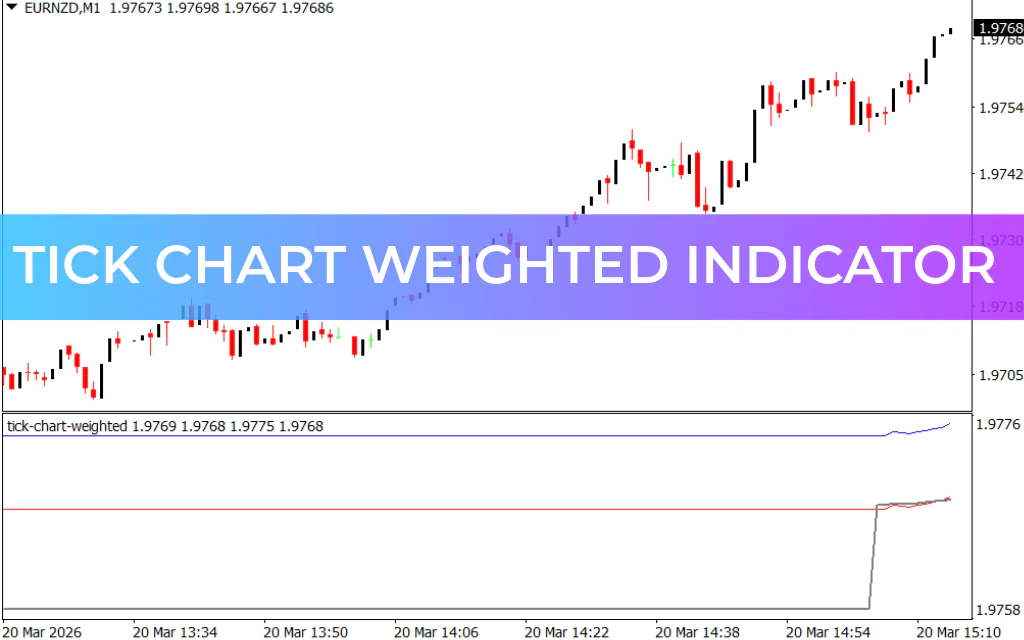
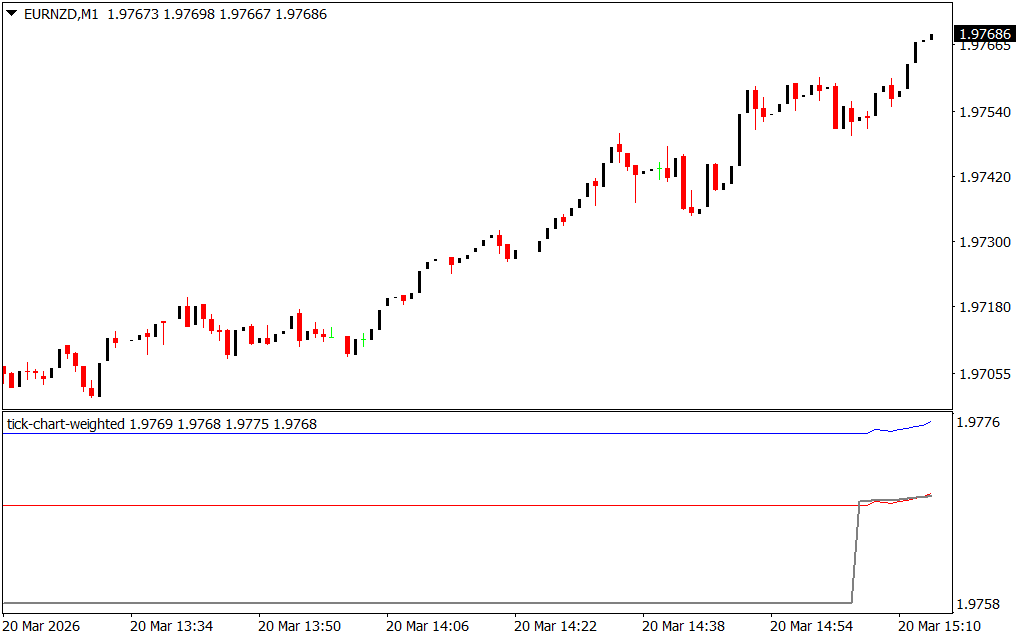
The Tick Chart Weighted Indicator for MT4 is a powerful tool designed for short-term and intraday traders who want deeper insights into market activity. Unlike standard time-based charts, this indicator creates price bars based on the number of transactions (ticks), allowing traders to better capture market volatility and price movements.
During periods of high activity, the indicator generates more bars than a traditional 1-minute chart, helping traders spot reversals faster and identify more trading opportunities.
How the Tick Chart Weighted Indicator Works
Instead of plotting candles based on time, the indicator builds them based on transaction volume (ticks). This means:
- More data during high volatility periods
- Fewer bars during low activity periods
- Improved visibility of market momentum and price behavior
The weighted price line is calculated using the formula:
(High + Low + Close + Close) ÷ 4
This calculation provides a smoother and more responsive price representation compared to traditional median or typical price formulas.
Key Features
- Tick-based charting for real-time market activity analysis
- Customizable tick settings for flexible trading styles
- Enhanced detection of price reversals and breakouts
- Ideal for Scalping and intraday trading strategies
- Provides dynamic Support And Resistance levels
How to Trade with Tick Chart Weighted Indicator
Trading with this indicator may seem complex at first, but the concept is straightforward once understood.
Trading Signals
- The weighted price line acts as a dynamic support and resistance level
- The bid line (red line) helps identify entry signals
Bearish Signal
- When the red bid line bounces downward from the weighted price line
- This suggests a potential price drop
- Enter a SELL trade with a stop loss above the recent swing high
Bullish Signal
- When the bid/price interaction moves upward from the weighted line
- This indicates a potential upward move
- Enter a BUY trade with a stop loss below the recent swing low
Trading Example
In a live market scenario, when the red line bounced downward from the weighted price line, it signaled a bearish move. Shortly after, the market dropped significantly, confirming the signal.
Similarly, when price reacted upward from the weighted line, it indicated a bullish opportunity, allowing traders to capture short-term gains.
Trading Tips
- Best used during high volatility sessions (e.g., London and New York sessions)
- Combine with trend indicators or Price Action for confirmation
- Adjust tick settings based on your trading strategy and asset
- Avoid trading during low-volume or sideways markets
Conclusion
The Tick Chart Weighted Indicator for MT4 is an advanced yet highly effective tool for traders who want to analyze real-time market activity and improve entry timing. By focusing on transaction-based price movement, it offers a unique perspective that traditional charts cannot provide.
FAQ
Published:
Mar 20, 2026 10:16 AM
Category: