The Keltner Channel is a simple yet powerful volatility-based trading indicator that helps traders identify high-probability entry points, detect potential market reversals, and improve overall trade profitability.
In this guide, we’ll explore how the indicator works, how it differs from similar tools, and how to build an effective trading strategy around it.
What Is the Keltner Channel?
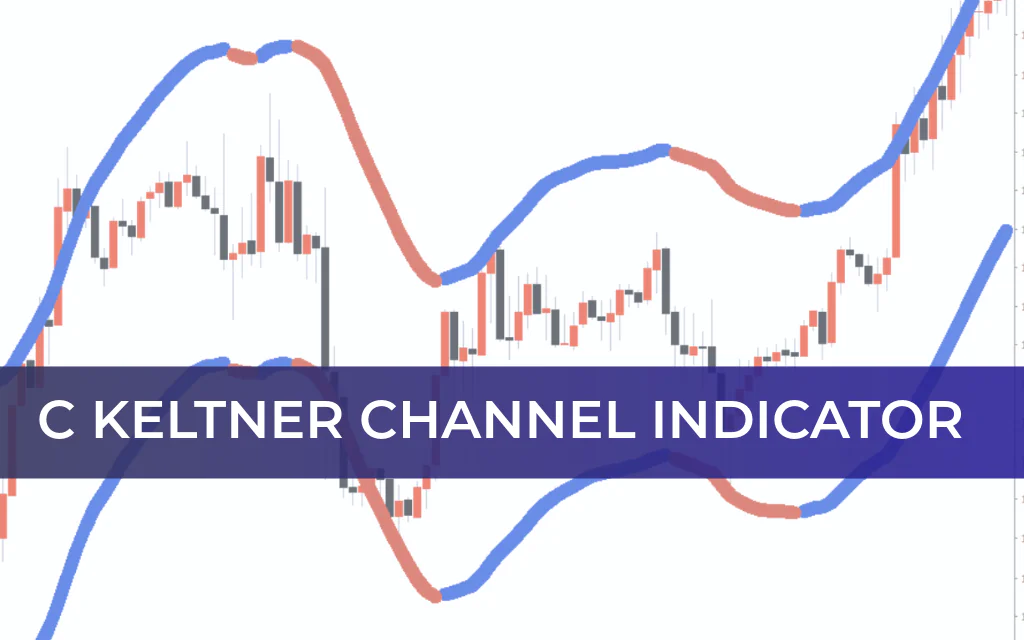
The Keltner Channel is a channel-based indicator, similar to Bollinger Bands and Donchian Channel.
It consists of three lines:
Middle Line – Exponential Moving Average (EMA)
Upper Band – EMA + Average True Range (ATR)
Lower Band – EMA − Average True Range (ATR)
The indicator was first introduced by Chester W. Keltner in 1960 in his book How to Make Money in Commodities. Later, Linda Raschke modified it by incorporating the Average True Range to calculate channel width. Eventually, Robert Colby suggested using an Exponential Moving Average (EMA), which is the modern version widely used today.
Keltner Channel vs Bollinger Bands
Although both indicators use upper and lower bands to define volatility, the calculation method differs:
Keltner Channel → Uses ATR to measure volatility
Bollinger Bands → Uses standard deviation
As a result, the Keltner Channel typically produces smoother and more consistent bands, while Bollinger Bands react more sharply to volatility spikes.
How to Use the Keltner Channel
A common mistake is shorting simply because price touches the upper band or buying because it touches the lower band.
In strong trends:
Price can remain near the upper band for extended periods in an uptrend
Price can remain near the lower band in a downtrend
Instead of blindly trading band touches, focus on:
Extreme price extensions beyond the channel
Key Support And Resistance levels
Market Structure confirmation
When price moves significantly beyond the channel, it signals that the market is stretched far from its average value — a potential reversal zone. However, always confirm with structure or momentum before entering a trade.
Keltner Channel Trading Strategy
Buy Setup
Wait for price to approach a strong support level
Look for Keltner Channel compression (price squeezed between the middle EMA and outer band)
Enter on a breakout from the compression zone
Place Stop Loss below the lower band
Set Take Profit near the next resistance level
Sell Setup
Wait for price to approach a strong resistance level
Identify channel compression
Enter on a breakout
Place Stop Loss above the upper band
Set Take Profit near the next support level
The Keltner Channel Squeeze
The “Keltner Squeeze” occurs when volatility contracts and price moves between the 20-period EMA and one of the outer bands.
This compression signals:
Reduced volatility
Potential buildup of momentum
Imminent breakout opportunity
The stronger the compression, the more powerful the potential breakout.
Key Trading Tips
Avoid counter-trend trades during strong momentum moves
Combine with support and resistance analysis
Use higher timeframes for clearer Trend Confirmation
Apply proper risk management
Final Thoughts
The Keltner Channel is a reliable volatility-based indicator that helps traders identify breakouts, reversals, and trend continuation opportunities. While it resembles Bollinger Bands in appearance, its ATR-based calculation makes it smoother and often more stable during trending markets.
For best results, use the Keltner Channel alongside market structure analysis and disciplined risk management. When applied correctly, it can significantly enhance both breakout and trend-following strategies.
FAQ
3 Downloads
Published:
Feb 20, 2026 01:25 AM
Category: