If you have been trading for a while, you are likely familiar with trend channels. They are widely used to predict price movements and identify potential Support And Resistance zones. However, manually drawing accurate channels can be challenging.
The Automatic Channel Indicator for MT4 eliminates this difficulty by automatically plotting structured trend channels on your chart.
What Is the Automatic Channel Indicator?
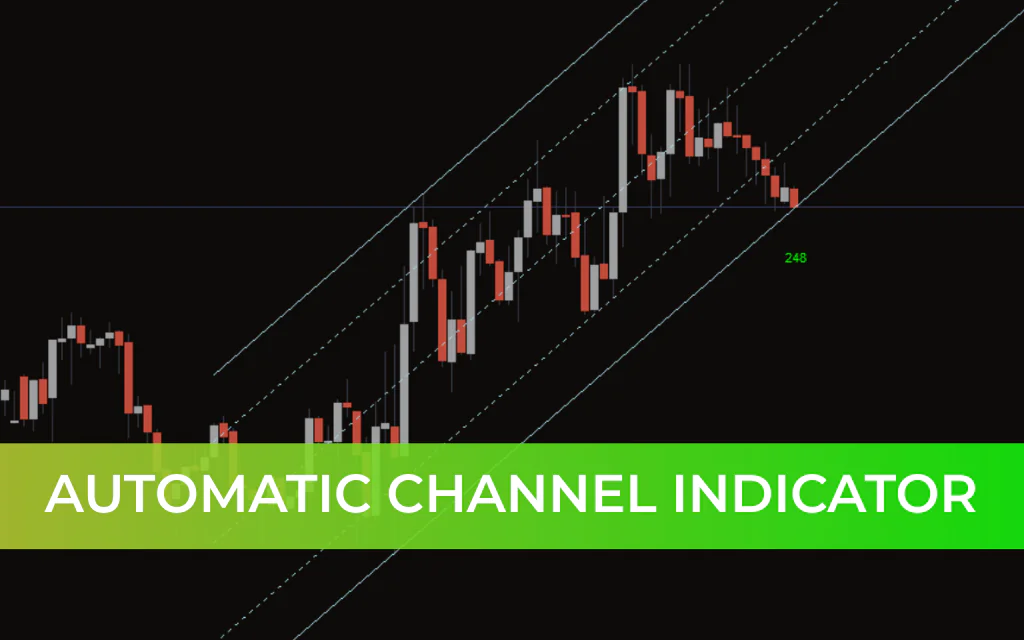
The Automatic Channel Indicator is a technical analysis tool that draws five parallel lines on the chart:
Two outer boundary lines
Two interior parallel lines
One central mid-line
The indicator forms a broad outer channel with an inner channel and a mid-line that intersects the entire structure. These parallel lines dynamically act as support and resistance levels, depending on price position.
Trend channels help traders identify:
The direction of the ongoing trend
The strength of momentum
The maturity of the trend
Potential reversal zones
When price approaches the outer boundary of the channel, the trend is often considered mature and potentially near a reversal.
How to Use the Automatic Channel Indicator
1. Identifying Support and Resistance
In an ascending channel:
Parallel lines slope upward.
Lower boundary acts as support.
Upper boundary acts as resistance.
The mid-line serves as a dynamic pivot.
If price falls below the mid-line in an ascending channel, it may indicate weakening bullish momentum.
In a descending channel:
Parallel lines slope downward.
Upper boundary acts as resistance.
Lower boundary acts as support.
A break above the mid-line may signal weakening bearish momentum.
Automatic Channel Trading Strategy
The indicator can be used for both reversal and breakout trading strategies. Below is a simple and effective reversal-based approach.
Buy Setup (Ascending Channel)
Price reaches the lower boundary of the channel.
Wait for clear price rejection (long wick or bullish reversal candle).
Enter a BUY position after bullish confirmation.
Stop Loss:
Slightly below the low of the rejection candle.
Take Profit:
At the mid-line or the next upper parallel line, depending on Trend Strength.
Sell Setup (Descending Channel)
Price reaches the upper boundary of the channel.
Wait for price rejection (bearish reversal candle).
Enter a SELL position after confirmation.
Stop Loss:
Slightly above the high of the rejection candle.
Take Profit:
At the mid-line or the next lower parallel line.
Breakout Strategy Option
Advanced traders may also trade breakouts:
Enter long when price breaks above the upper boundary with strong momentum.
Enter short when price breaks below the lower boundary.
Confirm breakouts with volume, trend indicators, or price structure.
Advantages of the Automatic Channel Indicator
Automatically draws five structured parallel lines
Eliminates manual channel drawing errors
Identifies dynamic support and resistance zones
Suitable for trend-following and reversal trading
Works on all timeframes
Important Trading Tip
While the Automatic Channel Indicator is powerful, it should not be used in isolation. Combine it with:
Trend Confirmation tools
Momentum indicators
Support and resistance analysis
Candlestick confirmation
Using confluence significantly improves trading accuracy.
Conclusion
The Automatic Channel Indicator for MT4 is an advanced yet easy-to-use tool that plots five parallel lines to define structured price channels. These lines help traders identify support, resistance, trend strength, and potential reversal zones.
By combining automatic channel plotting with proper Price Action analysis, traders can develop high-probability setups with controlled risk.
For best results, always confirm signals with additional technical tools.
FAQ
2 Downloads
Published:
Feb 20, 2026 06:44 AM
Category: