Elliott Wave Count Indicator for MT4 – Simplify Wave Analysis and Trading
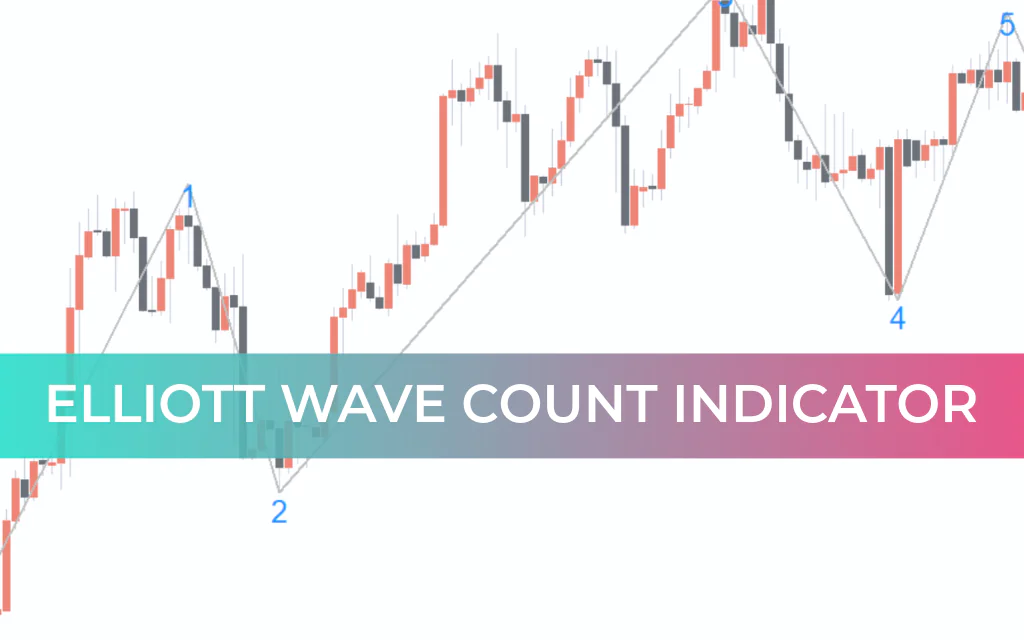
The Elliott Wave Count Indicator for MT4 is a powerful tool designed to automatically identify and count Elliott waves, making it easier for forex traders to implement the Elliott wave trading strategy. By visually representing waves, the indicator helps traders recognize BULLISH and BEARISH trends and determine optimal BUY and SELL entry points.
Suitable for both new and experienced traders, the indicator can be enhanced by using Fibonacci levels and additional technical tools to confirm trading signals. The indicator is free to download, easy to install, and works across all intraday and higher timeframes, including daily, weekly, and monthly charts.
How the Elliott Wave Count Indicator Works
The indicator identifies waves according to the 5-wave principle of Elliott waves:
Buy Setup (Bullish Wave):
Enter a BUY trade at the end of the second wave.
Place stop-loss below the swing low of the first wave.
Take profit at the end of the third or fifth wave.
Sell Setup (Bearish Wave):
Enter a SELL trade at the start of the third wave.
Place stop-loss above the swing high of the first wave.
Take profit at the end of the third or fifth wave.
Key Principles:
Trade the third and fifth waves, as other waves are often counter-trend.
Use wave beginning and endpoints as Support And Resistance levels.
Best results are achieved using multi-timeframe (MTF) analysis: identify the wave on a higher timeframe and refine entries on a lower timeframe chart.
Conclusion
The Elliott Wave Count Indicator for MT4 simplifies wave identification, allowing traders to focus on high-probability BUY and SELL setups. While the indicator automates wave counting, it is recommended to combine it with Price Action analysis to confirm wave starts and ends. The indicator is free, easy to install, and highly effective for trend-following and reversal strategies.
FAQ
6 Downloads
Published:
Feb 20, 2026 11:14 AM
Category: