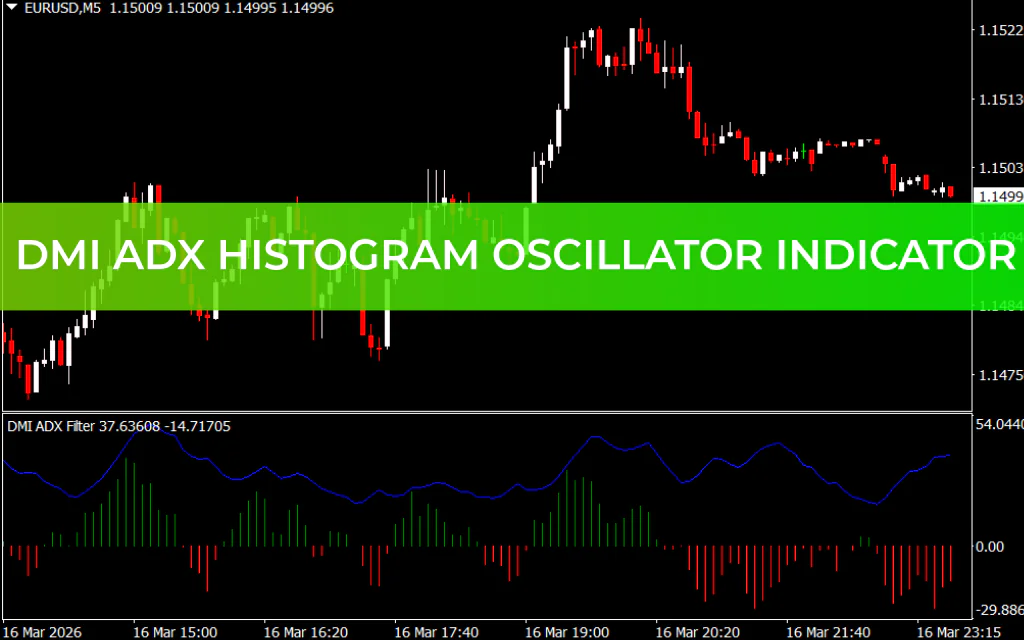
The DMI ADX Histogram Oscillator Indicator combines the Average Directional Index (ADX) and the Directional Movement Index (DMI) to provide forex traders with comprehensive trend analysis. While the ADX measures Trend Strength, the DMI shows trend direction, and together, they deliver clear buy and sell signals along with trend strength information.
This versatile indicator works on all trading instruments, including forex, stocks, indices, metals, and commodities, and is compatible with any timeframe. It is widely used by swing traders, intraday traders, and long-term traders alike.
How the DMI ADX Histogram Oscillator Works
The histogram replaces the traditional D+ and D− lines and displays the difference between D− and D+, while the ADX line continues to measure the trend’s strength.
- Green Histogram Bars: Indicate an uptrend.
- Red Histogram Bars: Indicate a downtrend.
- Zero Line: Acts as the key level for confirming trend direction.
Trading signals:
- Buy: When the histogram turns green above the zero line.
- Sell: When the histogram turns red below the zero line.
For best results, traders should check the ADX line to assess trend strength, which helps determine optimal exit points.
Using Divergence with the DMI ADX Histogram
The indicator is especially effective for spotting divergence, a leading signal for trend reversals:
- Bullish Divergence: Price forms lower lows while the histogram forms higher lows, signaling potential upward reversal.
- Bearish Divergence: Price forms higher highs while the histogram forms lower highs, signaling potential downward reversal.
By combining divergence signals with trend direction and strength, traders can anticipate trend weakness and reversals earlier than with traditional ADX or DMI alone.
Benefits of the DMI ADX Histogram Oscillator
- Provides trend direction, strength, and momentum in one indicator
- Generates clear buy and sell signals
- Works as a leading indicator when using divergence
- Compatible with all financial instruments and timeframes
- Suitable for new traders to visualize trends easily
- Allows advanced traders to create complex strategies with other indicators
The DMI ADX Histogram Oscillator simplifies trend analysis while providing enough flexibility for professional trading strategies.
Conclusion
The DMI ADX Histogram Oscillator Indicator for MT4 is an essential tool for forex and financial traders. By combining the ADX’s trend strength measurement with DMI’s directional analysis, the indicator gives buy and sell signals, trend strength visualization, and divergence alerts.
Traders can apply multi-timeframe analysis to maximize profits, making it suitable for both beginner and advanced trading strategies. This indicator is a must-have for anyone looking to trade trends confidently while monitoring momentum and potential reversals.
FAQ
Published:
Mar 16, 2026 18:39 PM
Category: