The All Pivot Points Indicator for MT4 is a powerful price-level tool built for the MetaTrader 4 platform. It calculates pivot points using historical candle data — Open, High, and Close (OHLC) — to define six key Support And Resistance levels.
These pivot levels are automatically updated after the close of the New York session, ensuring traders always work with fresh and relevant market data.
Support and resistance analysis is a core part of technical trading. The horizontal levels plotted by this indicator help traders identify:
Potential breakout zones
Trend continuation areas
Range-bound trading opportunities
Intraday reversal levels
The indicator is also compatible with multi-timeframe (MTF) analysis, allowing customization based on your trading style — whether Scalping, day trading, or swing trading. It works effectively in both forex and stock market analysis.
How the All Pivot Points Indicator Works
After installation in MT4, the indicator plots six horizontal levels directly on the main chart:
Top Three Lines → Resistance Levels (R1, R2, R3)
Bottom Three Lines → Support Levels (S1, S2, S3)
These levels are generated by the built-in automatic pivot point calculator and update daily.
The pivot lines act as dynamic price channels that price must interact with before continuing its move.
Trading Strategies Using the All Pivot Points Indicator
1️⃣ Range Trading Strategy
When price fails to break a pivot level:
The market is considered sideways or consolidating.
Look for reversal candlestick patterns near support or resistance.
Example:
If price fails to break the nearest resistance:
Expect a move back toward the support level.
Look for SELL entries near resistance.
Target the nearest support zone for take profit.
This method is especially useful for scalpers and intraday traders.
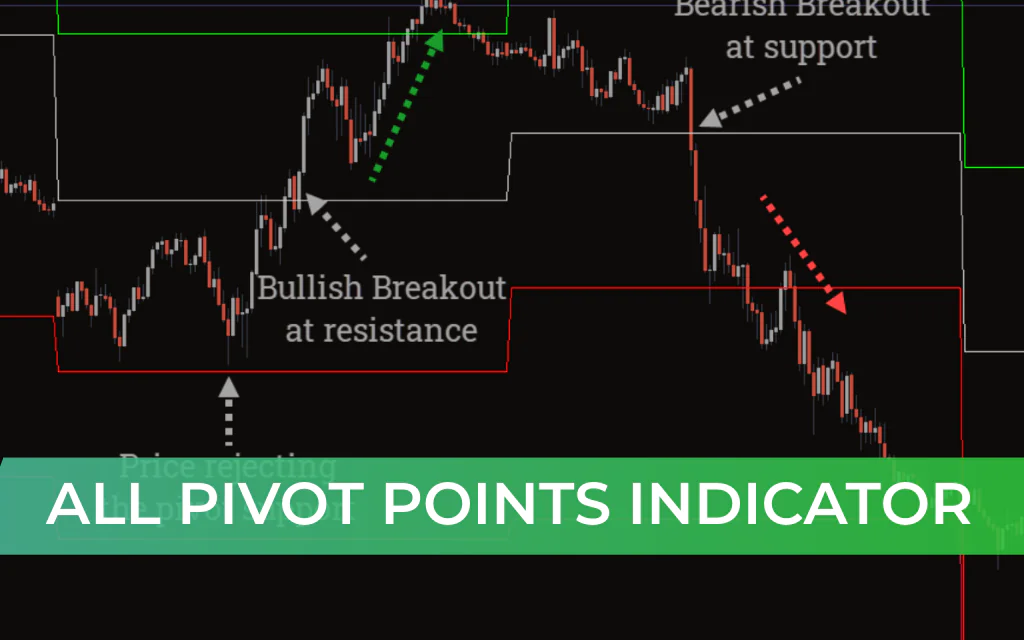
2️⃣ Breakout Trading Strategy
For breakout setups:
Wait for price to close decisively above resistance or below support.
Enter in the direction of the breakout.
Bullish Breakout Setup:
Price breaks above the nearest pivot resistance.
Enter BUY after confirmation.
Target the next resistance level.
Bearish Breakout Setup:
Price breaks below the nearest pivot support.
Enter SELL.
Target the next support level.
Breakout trading works best when supported by strong momentum and volume confirmation.
Why Traders Use the All Pivot Points Indicator
Automatically calculated daily pivot levels
Clear visual support and resistance zones
Ideal for scalping and intraday trading
Works well with Price Action strategies
Compatible with multi-timeframe analysis
Suitable for forex and stock markets
Best Practices
For improved accuracy:
Confirm signals with candlestick patterns
Monitor trading volume during breakouts
Combine with trend indicators (EMA, RSI, MACD)
Avoid trading false breakouts during low liquidity sessions
Conclusion
The All Pivot Points Indicator for MT4 is one of the most effective price-level tools available for MetaTrader traders. It automatically plots daily support and resistance zones while also highlighting intraday breakout opportunities.
Its simplicity makes it ideal for beginners, while its flexibility allows advanced traders to integrate it into sophisticated price-action strategies.
Whether you trade breakouts, reversals, or range-bound markets, this indicator provides a clear structural framework for identifying high-probability trading opportunities.
FAQ
1 Download
Published:
Feb 20, 2026 07:30 AM
Category: