The MACD True indicator is a momentum trend-following tool that shows the relationship between two exponential moving averages (EMAs). It is widely used by forex traders to confirm entry and exit points and to analyze overall market momentum.
What Is the MACD True Indicator?
The MACD (Moving Average Convergence Divergence) was originally developed by Gerald Appel in the late 1970s. Its main purpose is to track changes in market strength, direction, and momentum.
In 1986, Thomas Aspray added the histogram, allowing traders to visualize the difference between the MACD line and the signal line. This addition became the industry standard.
The default MACD in MetaTrader 4 does not fully replicate the original Appel-Aspray formula, which is where the MACD True indicator comes in. It restores the classic calculation and adds an extra signal line, making it easier to track trend changes and market momentum.
Key Difference from RSI:
MACD True measures the relationship between two EMAs (trend momentum).
RSI measures price changes relative to recent highs and lows (overbought/oversold conditions).
These indicators can occasionally provide contradictory signals, which is why combining them may improve trade decisions.
How to Use the MACD True Indicator
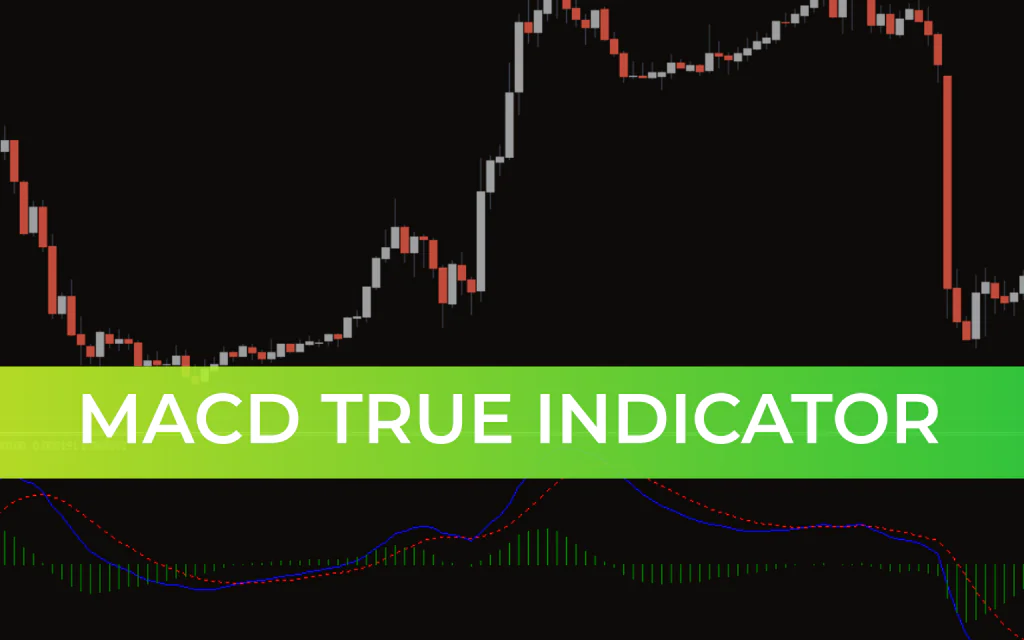
The MACD True uses three lines:
Fast EMA line – reacts quickly to price changes
Slow EMA line – smooths out overall trend
Signal line (usually 9-period EMA) – provides confirmation of trend shifts
Basic Trading Method
Buy Signal: Wait for the fast EMA to cross above the slow EMA. Enter at the opening of the next candle.
Sell Signal: Wait for the fast EMA to cross below the slow EMA. Enter at the opening of the next candle.
The MACD histogram bars indicate momentum:
Longer bars → stronger momentum
Compare current bars with previous bars → detect momentum increase or decrease
MACD True Trading Strategy
The MACD True can also highlight divergence and convergence, which can indicate trend reversals. This allows traders to take counter-trend positions strategically.
Buy Setup
MACD crosses below the signal line
MACD moves below the zero line
Enter long when MACD crosses above the signal line
Stop-loss: just below the recent swing low
Take profit: near next resistance level
Sell Setup
MACD crosses above the signal line
MACD moves above the zero line
Enter short when MACD crosses below the signal line
Stop-loss: just above the recent swing high
Take profit: near next support level
Conclusion
The MACD True indicator works similarly to the traditional MACD but adds a 9-period signal line for more precise Trend Confirmation. It is suitable for both intraday and swing trading and can help traders analyze price direction, Trend Strength, and momentum effectively.
By combining the MACD True with other tools like support/resistance levels, RSI, or trend lines, traders can increase the probability of successful entries and exits.
FAQ
1 Download
Published:
Feb 20, 2026 01:33 AM
Category: