Free
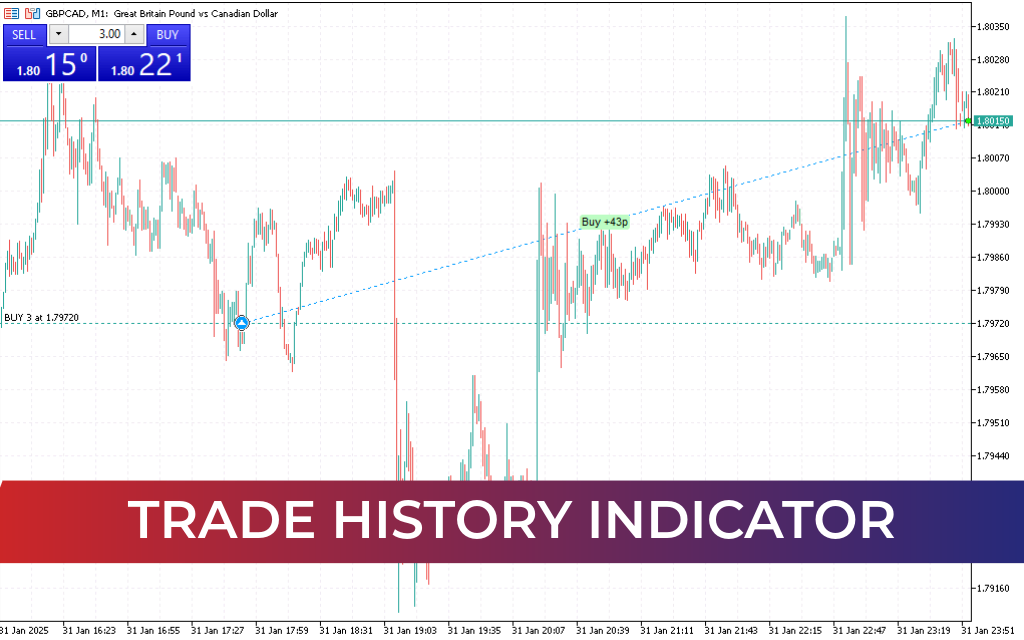
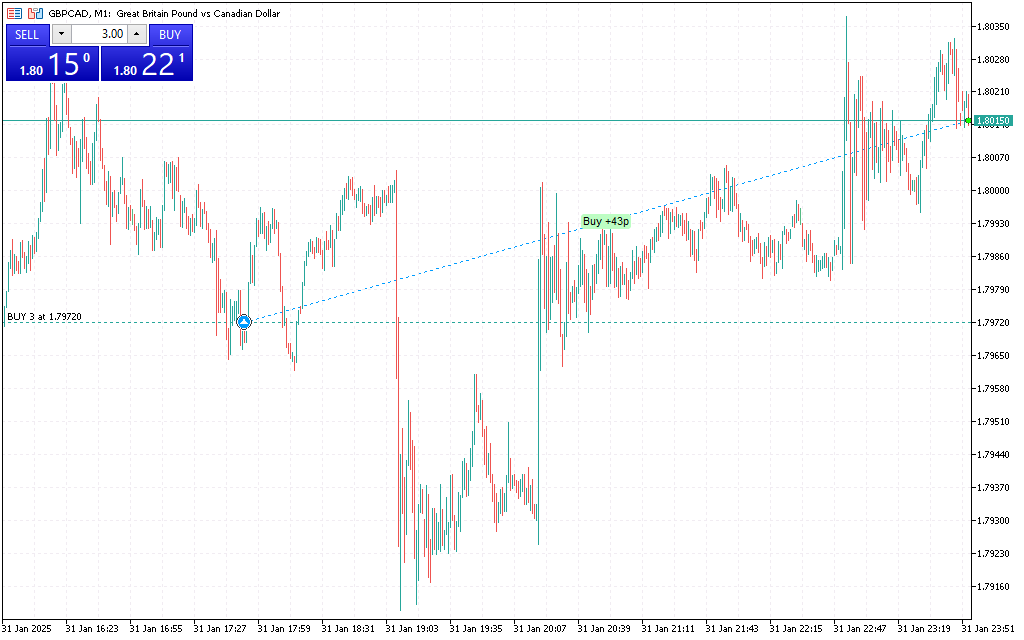
The Trade History Indicator for MetaTrader 5 is a visual tool that maps executed trades directly onto your chart, allowing you to analyze past performance, refine strategies, and improve trading decisions. It’s ideal for traders of all levels—from beginners reviewing mistakes to professionals optimizing trade execution.
How It Works
1️⃣ Visual Trade Mapping
- Plots entries and exits of all executed trades
- Displays profit and loss levels in points or pips
- Helps identify which setups worked and which didn’t
2️⃣ Trade Analysis
- Review multiple trades in a single view
- Detect recurring mistakes or missed opportunities
- Quantify results to evaluate strategy effectiveness
3️⃣ Applications
- Day Trading: Quickly spot successful intraday setups
- Swing Trading: Analyze patterns over several days or weeks
- Long-Term Investing: Review trades to refine position sizing and timing
Key Features
- Automatic plotting of trade entries, exits, and P/L levels
- Clear, color-coded markers for winning and losing trades
- Works across all instruments and timeframes
- Helps refine strategy without leaving the chart
- Supports performance improvement and risk management
Conclusion
The Trade History Indicator MT5 transforms your past trading data into an intuitive, actionable visual format. By showing exactly where trades were opened, closed, and how they performed, it helps traders learn from experience, optimize strategies, and avoid repeating errors. A must-have for any serious trader looking to improve decision-making and trade management on MetaTrader 5.
FAQ
Plots entries and exits of all executed trades. Displays profit and loss levels in points or pips. Helps identify which setups worked and which didn't. Review multiple trades in single view. Detect recurring mistakes or missed opportunities. Quantify results.
Day trading: spot successful intraday setups. Swing trading: analyze patterns over days or weeks. Long-term: refine position sizing and timing.
All levels—beginners reviewing mistakes to professionals optimizing execution. MT5.
Analyze past performance. Refine strategies. Improve trading decisions.
Entries, exits, P/L levels. Color-coded markers for winning and losing trades.
1 Download
Published:
Mar 03, 2026 10:56 AM
Category:
Share: