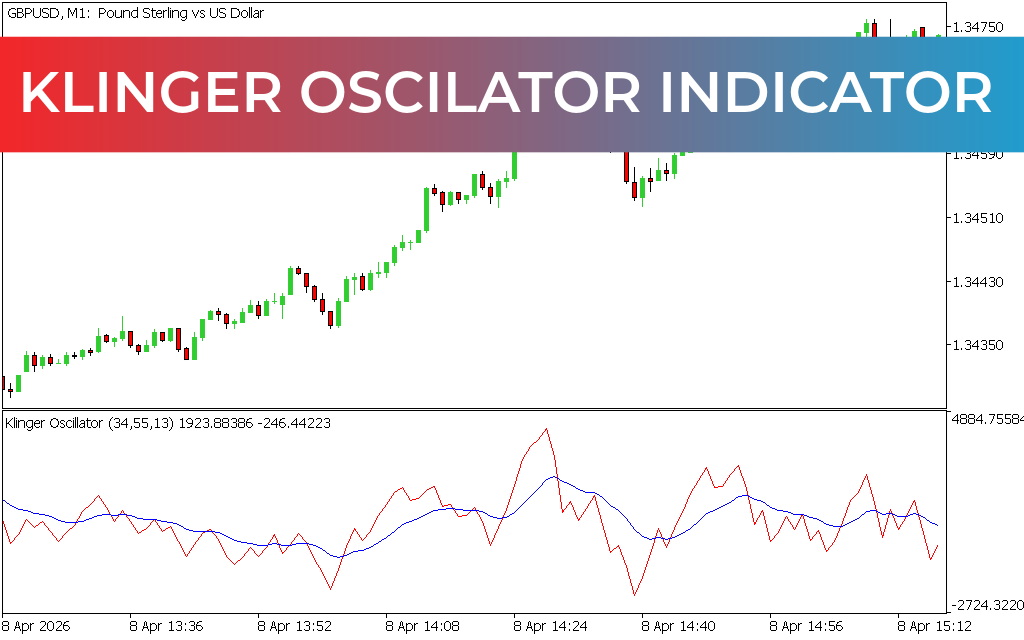
The Klinger Oscillator Indicator for MetaTrader 5 (MT5), also known as the Klinger Volume Oscillator, is a technical tool designed to measure the long-term trend of money flow. While it resembles the MACD visually, it operates differently by comparing price volume strength with market Trend Strength to generate buy and sell signals.
How It Works
- Klinger Line: Built using algorithms that evaluate price volume strength.
- Histogram Bars:
- Above zero line → bullish trend.
- Below zero line → bearish trend.
- Signal Line (Blue): Confirms sentiment when crossing above or below the zero line.
Trading Signals
- Bullish Setup: Histogram bars and signal line above the zero line indicate upward momentum.
- Bearish Setup: Histogram bars and signal line below the zero line confirm downward momentum.
- Reversal Zones: Crossovers between the Klinger line and signal line highlight potential trend reversals.
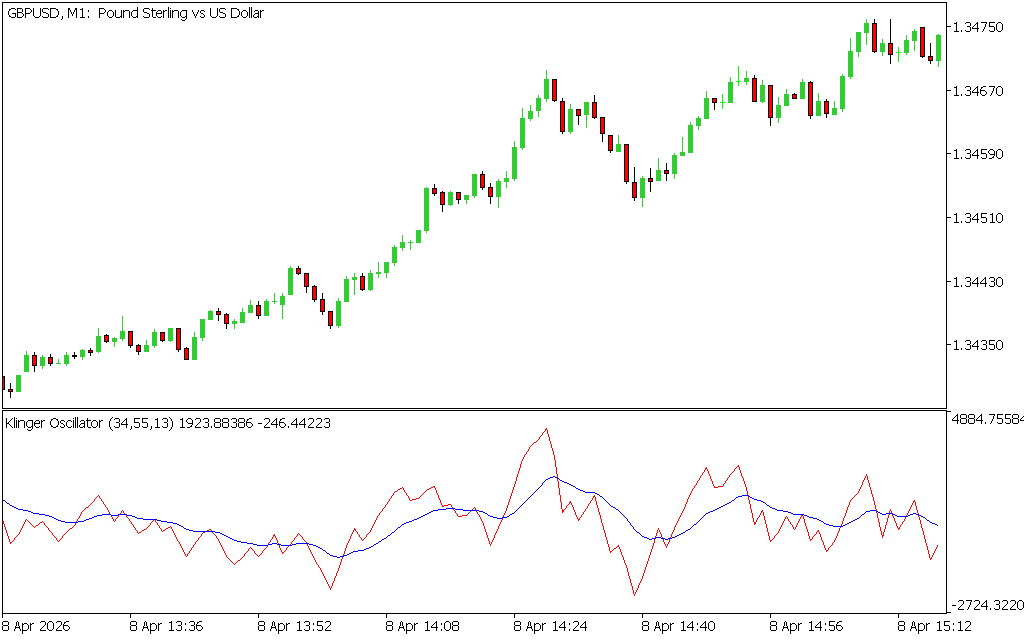
Example: EUR/USD H1 Chart
On the EUR/USD H1 timeframe, the indicator showed a bearish trend as both the histogram bars and signal line were below the zero line. Price Action confirmed the sell entry by retesting a bearish order block, aligning with the oscillator’s signals.
Key Features
- Volume-Based Analysis: Evaluates the relationship between price volume and trend strength.
- Clear Visuals: Histogram and signal line make sentiment easy to interpret.
- Versatility: Suitable for scalpers, day traders, and swing traders.
- Confirmation Tool: Best used alongside price action or other indicators.
Conclusion
The Klinger Oscillator Indicator for MT5 is a reliable trading tool that helps determine true trend direction and reversal zones. Free to download, it is recommended for traders of all levels, especially those focusing on intraday and short-term strategies.
Published:
Apr 08, 2026 13:45 PM
Category: