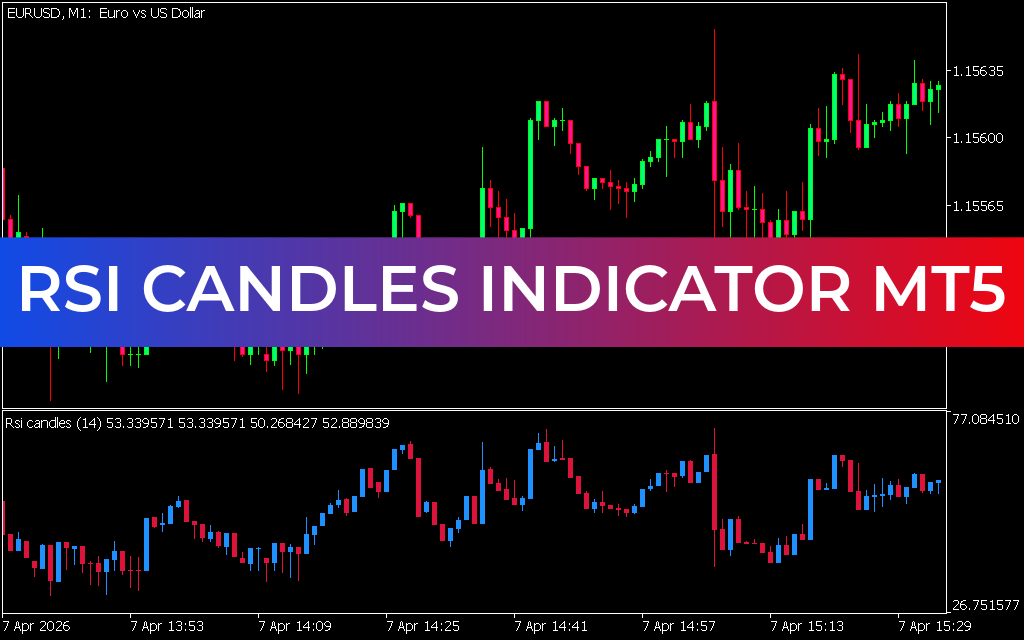
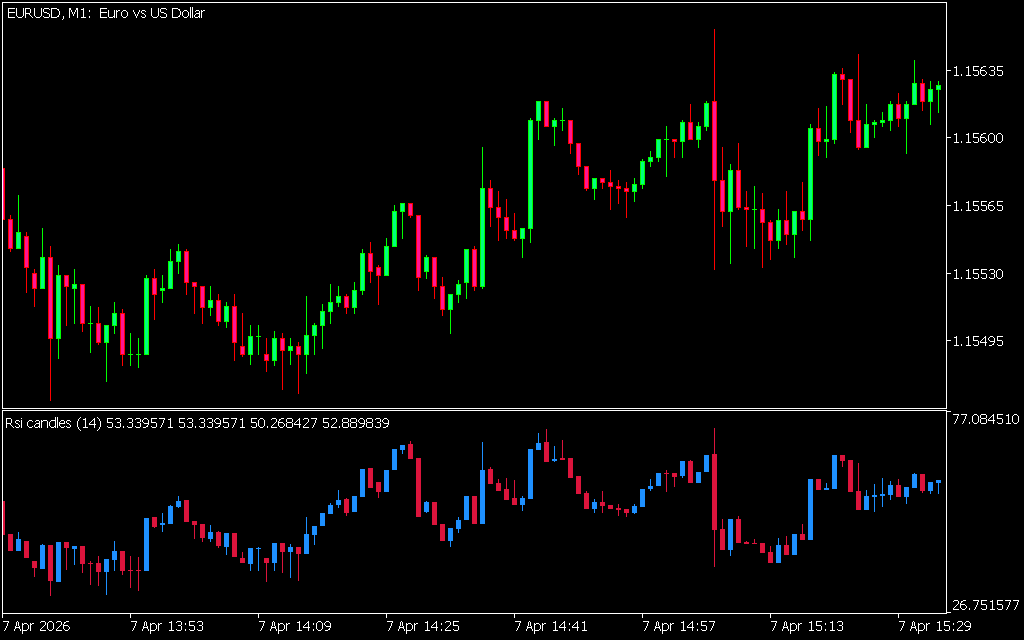
The RSI Candles Indicator for MT5 is a trading tool that integrates the Relative Strength Index (RSI) directly into candlesticks. Instead of displaying the RSI in a separate window, the indicator changes the color of each candle based on RSI values, making it easier to visualize bullish and bearish sentiment without cluttering the chart.
How the RSI Candles Indicator Works
- RSI Level 50: The indicator revolves around the 50.00 level of the RSI.
- Bullish Sentiment: When RSI rises above 50, the candle turns blue, signaling potential bullish momentum.
- Bearish Sentiment: When RSI falls below 50, the candle turns red, indicating bearish pressure.
- Simplified Analysis: Focuses only on trend direction, not overbought/oversold zones like the traditional RSI.
How to Read RSI Candles
- Blue Candles – RSI above 50, suggesting bullish bias.
- Red Candles – RSI below 50, suggesting bearish bias.
- Trend Confirmation – Use alongside Price Action patterns for stronger signals.
For example, if the EURUSD chart shows consecutive red bars, it indicates RSI consistently below 50, confirming a strong bearish trend.
How to Trade with RSI Candles
- Combine with Price Action: Use candlestick patterns (e.g., engulfing, pin bars) for entry confirmation.
- Pair with Other Indicators: Add moving averages or MACD to filter false signals.
- Avoid Standalone Use: RSI Candles should be part of a broader trading strategy.
Benefits
- Simplifies RSI interpretation by embedding it into candles.
- Keeps charts clean and uncluttered.
- Provides quick visual cues for trend direction.
- Suitable for traders of all levels.
Conclusion
The RSI Candles Indicator for MT5 is a streamlined tool that displays bullish and bearish sentiment directly on candlesticks. By focusing on RSI values around the 50 level, it helps traders quickly identify trend direction while leaving room for other technical analysis tools.
1 Download
Published:
Apr 07, 2026 12:40 PM
Category: