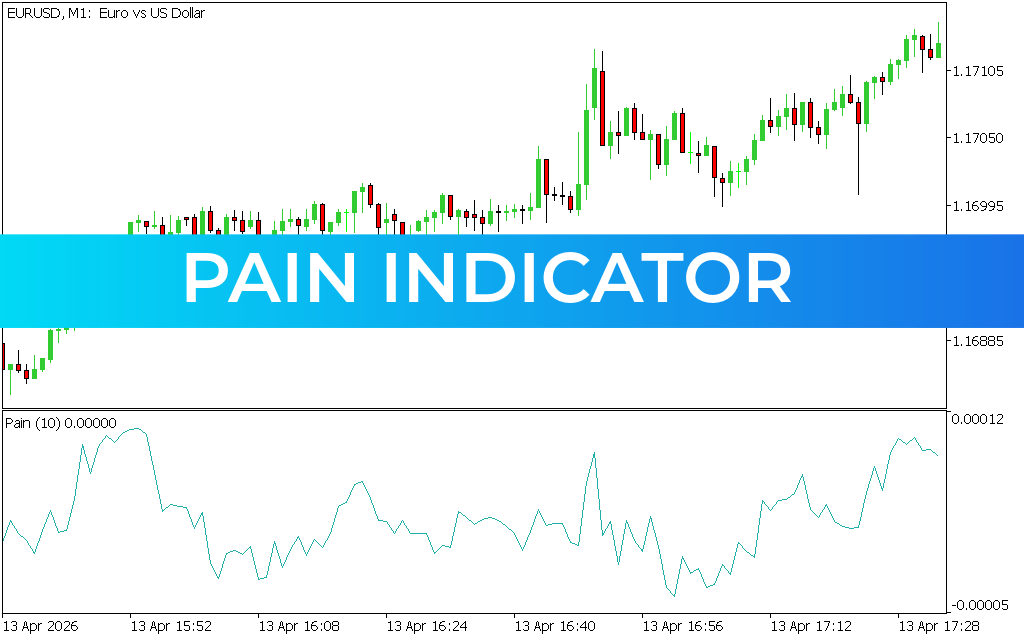
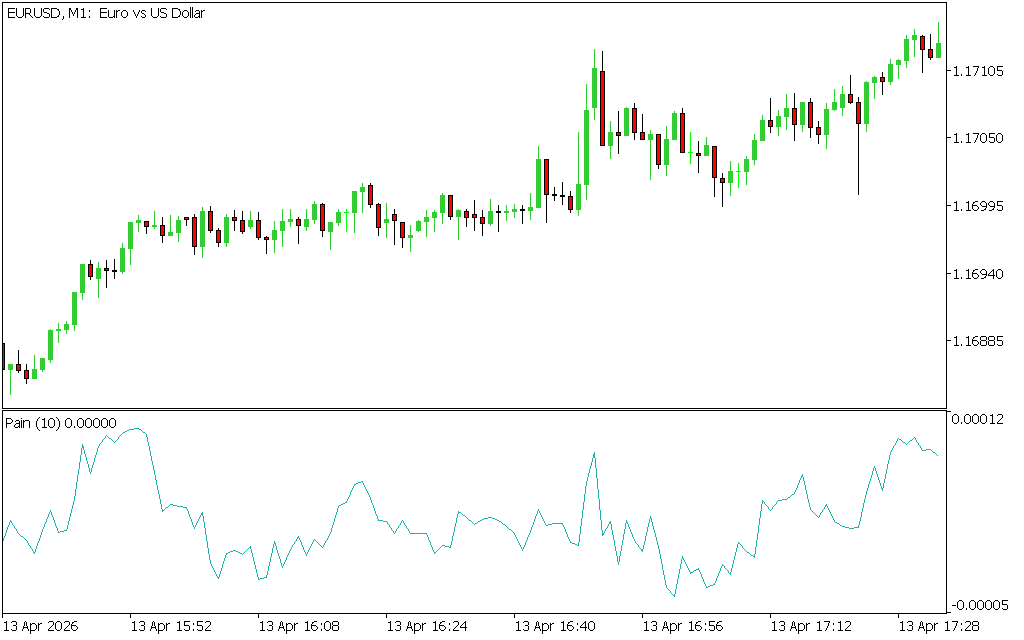
The Pain Indicator is a technical analysis tool designed for the MetaTrader 5 (MT5) platform. It helps traders evaluate market sentiment, price volatility, and potential trend direction by analyzing the underlying pressure from buyers and sellers.
Unlike traditional indicators that generate direct buy or sell signals, the Pain Indicator focuses on measuring market emotion and strength, giving traders a clearer understanding of what major market participants may be doing.
What Is the Pain Indicator?
The Pain Indicator is built to reflect the profit and loss pressure in the market over a selected period. This allows it to estimate how “painful” current Price Action is for traders on either side of the market.
Its main purpose is to:
- Assess bullish vs bearish sentiment
- Track market volatility and pressure
- Predict possible future price direction
- Help identify trend continuation or breakout potential
It works across all market conditions, including trending and sideways markets.
How the Pain Indicator Works
The indicator calculates its values based on price performance over time, adjusting dynamically as the market moves.
Key Behavior
- The indicator line moves upward during bullish trends
- The indicator line moves downward during bearish trends
- It reflects changes in trader sentiment rather than direct trade signals
This makes it a useful tool for understanding market psychology behind price movement.
Using the Pain Indicator for Trend Analysis
Although the Pain Indicator does not provide explicit buy or sell signals, it is highly effective when analyzing trend strength and Market Structure.
Bullish Trend Interpretation
In an uptrend:
- The indicator forms higher lows
- Price remains above previous support levels
- Pullbacks do not break prior swing lows
- Indicator curve continues to rise during consolidation
This suggests strong buy-side dominance and continuation potential.
Bearish Trend Interpretation
In a downtrend:
- The indicator forms lower highs
- Price struggles to break resistance levels
- Indicator curve steadily declines
- Sell pressure dominates market behavior
This reflects strong bearish sentiment and selling momentum.
How to Identify Market Opportunities
The Pain Indicator is especially useful in both trending and ranging markets:
In Trending Markets
- Helps identify pullback zones
- Confirms whether trend is still strong
- Assists in joining ongoing momentum
In Sideways Markets
- Highlights potential breakout direction
- Shows accumulation of bullish or bearish pressure
- Helps anticipate expansion moves
Why Market Sentiment Matters
Market direction is influenced by both:
- Technical factors (support/resistance, breakouts)
- Fundamental factors (news, economic events, sentiment shifts)
Events like major news releases or key breakout levels can quickly change trader behavior. The Pain Indicator helps simplify this by visually representing whether buyers or sellers currently have control.
Advantages of the Pain Indicator
- Measures real market sentiment strength
- Works in trending and ranging conditions
- Helps confirm trend continuation
- Useful for identifying breakout potential
- Easy to interpret even for beginner traders
Final Thoughts
The Pain Indicator for MT5 is a valuable tool for understanding the hidden strength behind price movements. Instead of focusing on direct signals, it helps traders analyze the emotional and psychological pressure in the market, which often drives future price action.
By combining sentiment analysis with traditional technical tools, traders can make more informed decisions and better understand whether a trend is likely to continue or reverse.
1 Download
Published:
Apr 13, 2026 12:10 PM
Category: