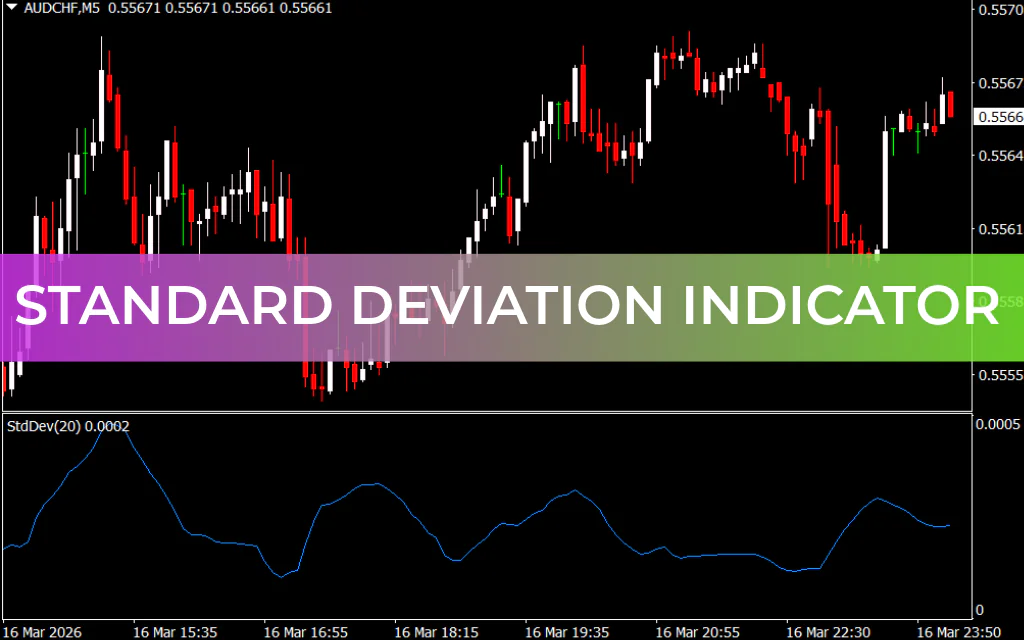
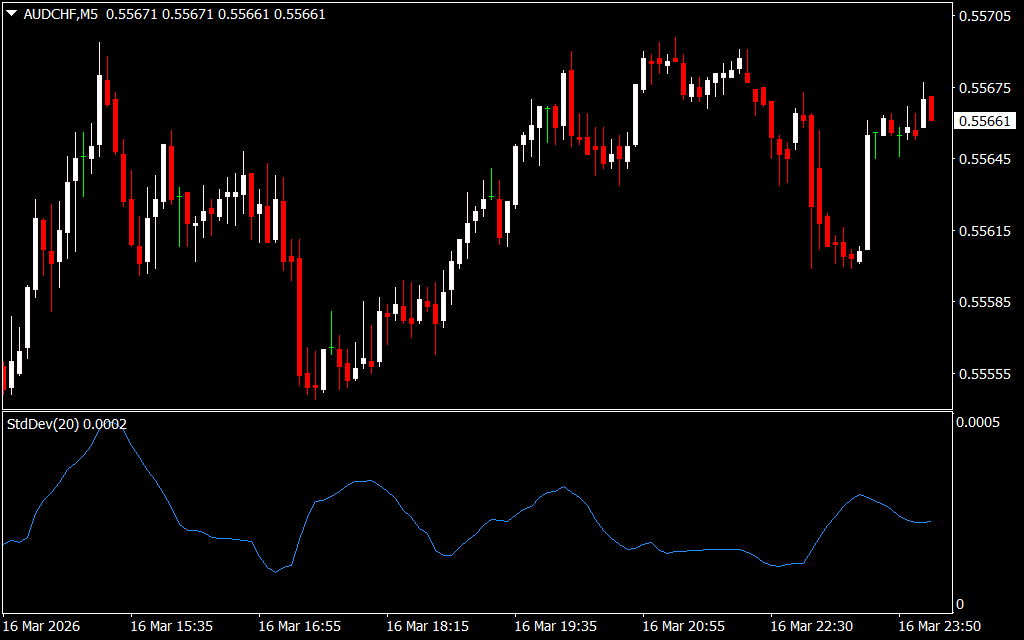
The Standard Deviation (SD) indicator is a statistical tool used in technical analysis to measure market volatility. It identifies periods of activity and dormancy by calculating the deviation of price from a selected moving average. Traders can use this information to anticipate strong price movements and potential breakouts.
How the Standard Deviation Indicator Works
- Concept:
The SD indicator determines how far the current price deviates from a chosen moving average.- Upward deviation → Selling pressure predominates
- Downward deviation → Buying pressure predominates
- Within boundaries → Price is in equilibrium (flat or dormant zone)
- Calculation Formula:
StdDev(i)=∑k=1n(ApPRICE(k)−SMA(ApPRICE,n,i))2n\text{StdDev}(i) = \sqrt{\frac{\sum_{k=1}^{n} (ApPRICE(k) - SMA(ApPRICE, n, i))^2}{n}}StdDev(i)=n∑k=1n(ApPRICE(k)−SMA(ApPRICE,n,i))2
Where:
- nnn → smoothing period
- ApPRICE(i)ApPRICE(i)ApPRICE(i) → applied price of the current bar
- SMASMASMA → selected moving average
- The absolute SD value is less important than its direction and rate of change, which indicate market activity.
Trading Signals Using Standard Deviation
Buy Strategy:
- Identify a flat/dormant market (low SD values).
- Wait for SD to increase and break out of the flat zone.
- Look for a bullish candle to confirm upward momentum.
- Enter a BUY trade with stop-loss below the local low.
- Take profit near the next horizontal resistance level.
Sell Strategy:
- Identify a flat/dormant market.
- Wait for SD to rise and break out of the equilibrium zone.
- Look for a bearish candle to confirm downward momentum.
- Enter a SELL trade with stop-loss above the local high.
- Take profit near the next horizontal support level.
Key Benefits
- Volatility Assessment: Easily identifies when the market is dormant or active.
- Breakout Signals: Rising SD indicates stronger price movements, suitable for trend trading.
- Flexible: Works on any timeframe for Scalping, intraday, or swing trading.
- Complementary Tool: Can be combined with trend indicators, support/resistance levels, or candlestick patterns to confirm trades.
Conclusion
The Standard Deviation indicator is a reliable tool for understanding market activity and volatility. It does not indicate trend direction directly but helps traders anticipate active phases for profitable trades. To maximize accuracy, use SD in combination with other indicators or Price Action techniques.
FAQ
Published:
Mar 16, 2026 19:12 PM
Category: