The TTM Indicator is a simple yet powerful trend-following tool designed for MetaTrader 4. The name TTM stands for Trade The Market, a concept introduced by trading educators John Carter and Hubert Senters in their trading strategies.
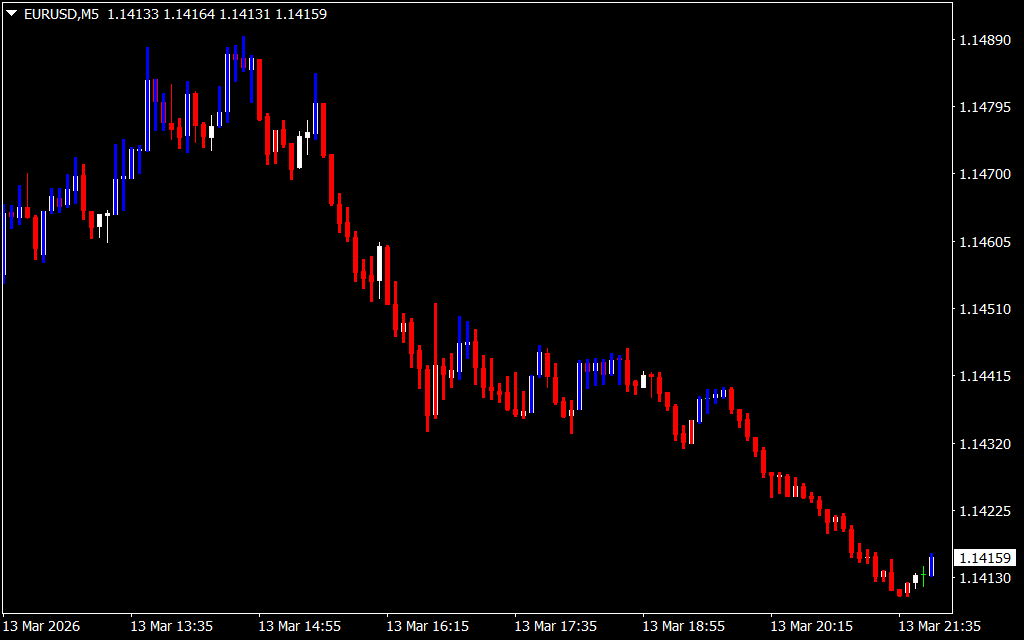
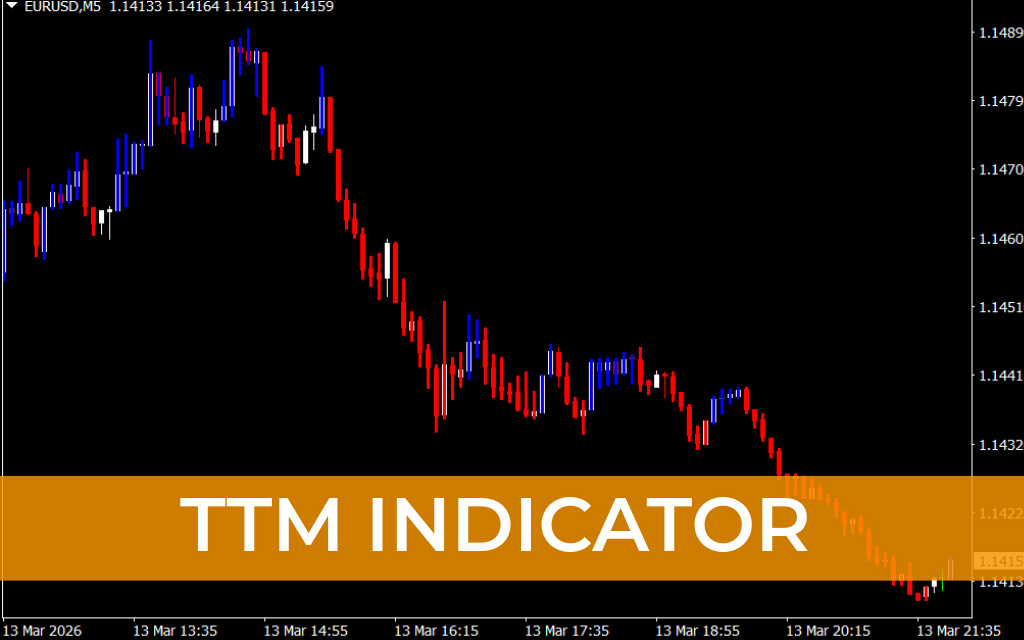
This indicator helps traders filter market noise and identify strong trends by overlaying colored bars on traditional candlestick charts. Instead of focusing on every price fluctuation, the TTM indicator highlights only strong trending candles, making it easier to read market direction.
- Blue bars indicate a bullish trend
- Red bars indicate a bearish trend
If the market lacks strong momentum, the indicator simply skips weak candles, helping traders avoid confusing signals.
How the TTM Indicator Works
The TTM indicator is built using Heikin Ashi candle calculations. Unlike standard candlesticks, Heikin Ashi modifies price data to smooth out market fluctuations and highlight trends more clearly.
Standard Candlestick Formula
- Open
- High
- Low
- Close
Heikin Ashi Formula
- Close
- Open
- High
- Low
Because of this calculation method, Heikin Ashi candles reduce noise and make it easier to spot trend continuation or reversals.
The TTM indicator applies these calculations and then paints colored bars directly on the chart, highlighting only the strongest price movements.
Key Benefits of the TTM Indicator
- Filters out market noise
- Highlights clear trend direction
- Works on all timeframes
- Easy to interpret for beginners
- Helps identify trend continuation or reversals
Because the indicator ignores weak market movement, traders can focus only on strong momentum setups.
How to Trade with the TTM Indicator
The TTM indicator is straightforward to use because it relies on color-based signals.
- Blue bars = bullish momentum
- Red bars = bearish momentum
However, a key rule when trading with this indicator is to wait for consecutive bars before entering a trade. Since the indicator skips weak candles, neutral candles may appear within a trend.
For better confirmation, many traders combine the TTM indicator with a volume indicator.
TTM Indicator Buy Strategy
Follow these steps for a buy setup:
- Look for blue bars on the chart.
- Wait until two consecutive blue bars appear.
- Enter a buy trade after confirmation.
- Place the stop-loss near the recent swing low.
- Exit the trade when a red bar appears.
This setup indicates strong bullish momentum.
TTM Indicator Sell Strategy
Follow these steps for a sell setup:
- Identify red bars on the chart.
- Wait for two consecutive red bars.
- Enter a sell trade after confirmation.
- Place the stop-loss near the recent swing high.
- Exit the trade when a blue bar appears.
This setup suggests strong bearish momentum.
Trading Tips for Better Accuracy
To improve results when using the TTM indicator:
- Wait for multiple consecutive bars before entering trades.
- Combine the indicator with volume analysis.
- Avoid trading during low-volatility or sideways markets.
These steps can help filter weak signals and focus on high-probability trading setups.
Conclusion
The TTM Indicator is a simple but effective tool for identifying strong market trends and filtering out chart noise. By using Heikin Ashi calculations, it highlights only the most significant price movements, making it easier for traders to spot opportunities.
Because of its simplicity and adaptability, the indicator works well on any timeframe and can be combined with volume indicators or other technical tools for improved trading accuracy.
FAQ
Published:
Mar 14, 2026 07:53 AM
Category: