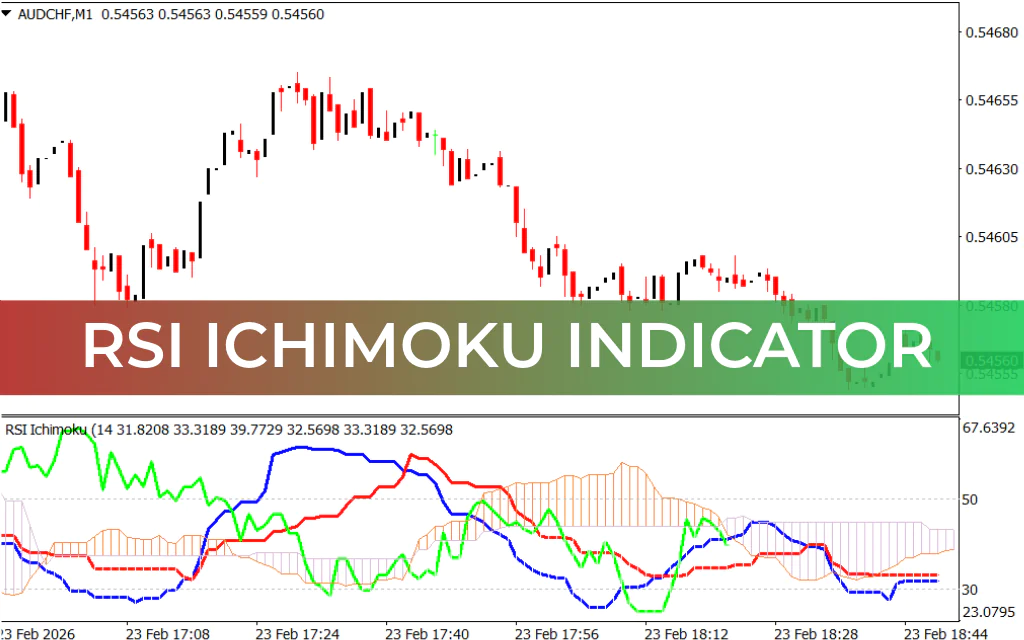
The RSI Ichimoku Indicator is an advanced technical analysis tool that combines the Relative Strength Index (RSI) with the Ichimoku Cloud, allowing traders to analyze both market momentum and trend direction in a single indicator. This integration helps identify high-probability trade setups, making it ideal for forex, stock, or commodity trading.
How It Works
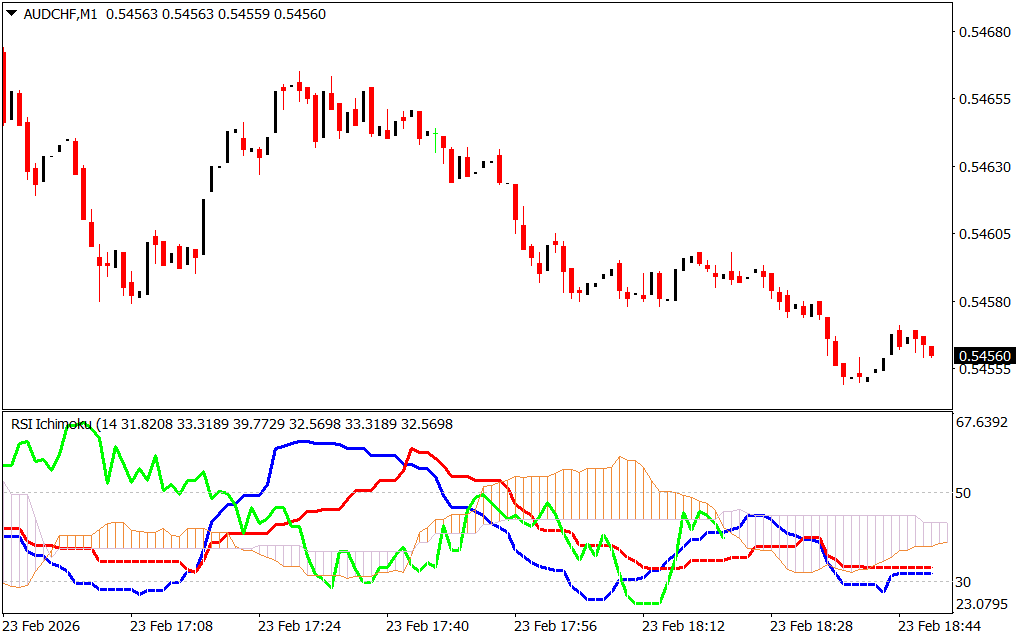
The indicator overlays RSI values with Ichimoku components like Tenkan-sen, Kijun-sen, and Senkou Span lines. By combining these signals:
- Bullish Signals:
- RSI moves above 50
- Price is above the Ichimoku cloud
- Confirms an uptrend with strong momentum
- Bearish Signals:
- RSI drops below 50
- Price is below the Ichimoku cloud
- Confirms a downtrend with strong momentum
- Crossovers & Trend Reversals:
- RSI crossing key Ichimoku levels can indicate potential reversals or trend continuations
- Provides early warning signals for entering or exiting trades
This dual-analysis approach allows traders to filter false signals and increase the probability of successful trades.
Key Benefits
- Combines trend and momentum analysis in one tool
- Highlights high-probability trade setups
- Works in trending and ranging markets
- Provides early signals for potential reversals
- Enhances entry and exit timing by confirming trade direction
Conclusion
The RSI Ichimoku Indicator for MT4 is a versatile tool that merges the strengths of RSI and Ichimoku Cloud. By combining momentum with Trend Confirmation, it helps traders identify stronger trade opportunities and make more informed decisions. This indicator is particularly valuable for traders seeking to refine entries and exits while maintaining a clear view of Market Structure and momentum.
FAQ
1 Download
Published:
Feb 23, 2026 12:50 PM
Category: