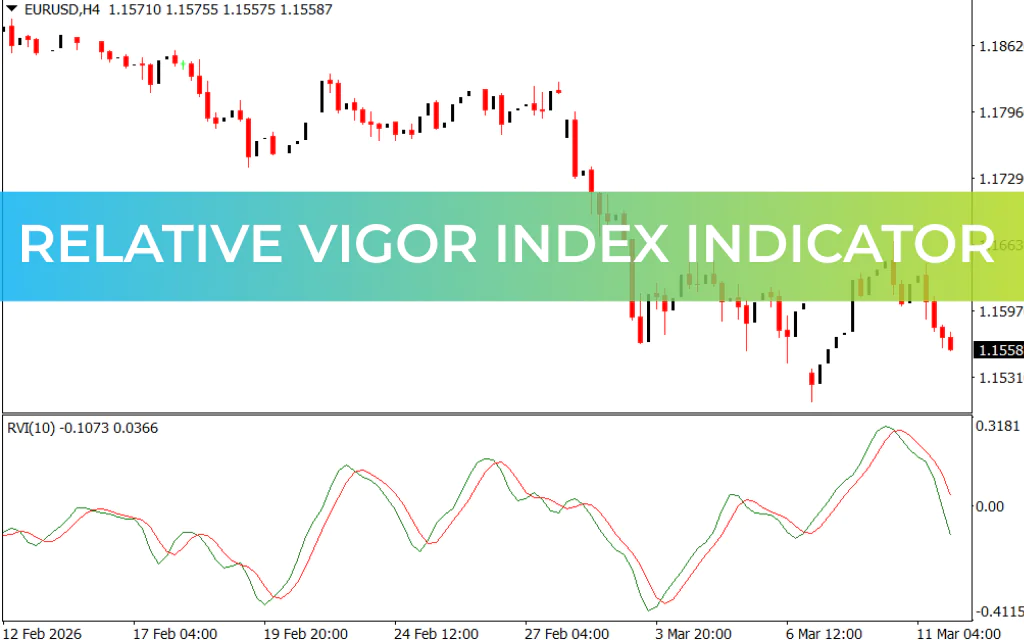
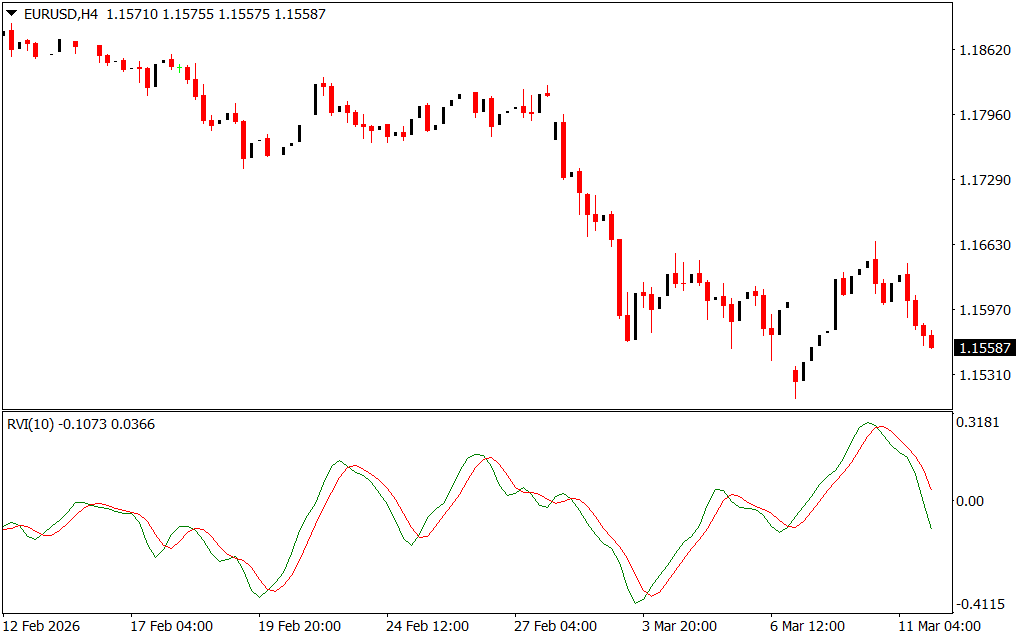
The Relative Vigor Index (RVI) is a technical indicator that measures the strength and sustainability of a market trend. It operates on the principle that prices tend to close near their highs during an uptrend and near their lows during a downtrend, so the magnitude of price movement relative to the close can signal potential trend continuation or reversal.
The RVI can be applied to forex, stocks, commodities, and other markets, and it works on all chart timeframes. Traders can use it as a stand-alone tool or in combination with other technical indicators and price patterns for more robust trading decisions.
How the RVI Works
The RVI consists of two lines:
- Main Line (Green) – Represents the relative vigor of price movement. Calculated using the difference between the closing price and its moving average.
- Signal Line (Red) – A moving average of the main line that smooths out fluctuations.
Interpretation
- Bullish Signal: When the main line crosses above the signal line (green line above red line), it indicates upward momentum and a potential start of a bullish trend.
- Bearish Signal: When the main line crosses below the signal line (red line above green line), it indicates downward momentum and a potential start of a bearish trend.
- Neutral Trend: A reading around 50 suggests no clear trend is in place.
Trading Signals
Traders typically look for three types of signals:
- Buy Signal: Main line crosses above 20 from below, indicating bullish momentum.
- Sell Signal: Main line crosses below 80 from above, signaling bearish momentum.
- Exit / Take Profit: Main line crosses back above 20 after being below 80, confirming a potential trend change.
Practical Example
- During an uptrend, prices close near their highs, RVI rises, and the green line crosses above the red line.
- During a downtrend, prices close near their lows, RVI falls, and the red line crosses above the green line.
Why Use the RVI
- Identifies overbought and oversold conditions
- Confirms Trend Strength and momentum
- Can be combined with moving averages, Price Action, or other indicators for higher accuracy
- Useful for Scalping, intraday, and swing trading
Conclusion
The Relative Vigor Index (RVI) is a versatile and intuitive tool for traders seeking to measure trend strength and momentum. Its simplicity lies in the two-line crossover system: green above red for bullish trends, red above green for bearish trends. Whether used independently or with other technical tools, RVI helps traders identify potential trend reversals and overextended market conditions, improving trade timing and decision-making.
FAQ
Published:
Mar 11, 2026 18:32 PM
Category: